On Wednesday, September 20th the Bureau of Economic Analysis released the 2016 Gross Domestic Product figures for Metropolitan areas across the country.
Gross domestic product (GDP) by metropolitan area is the sub-state counterpart of the Nation’s gross domestic product (GDP), the Bureau’s featured and most comprehensive measure of U.S. economic activity. GDP by metropolitan area is derived as the sum of the GDP originating in all the industries in the metropolitan area.
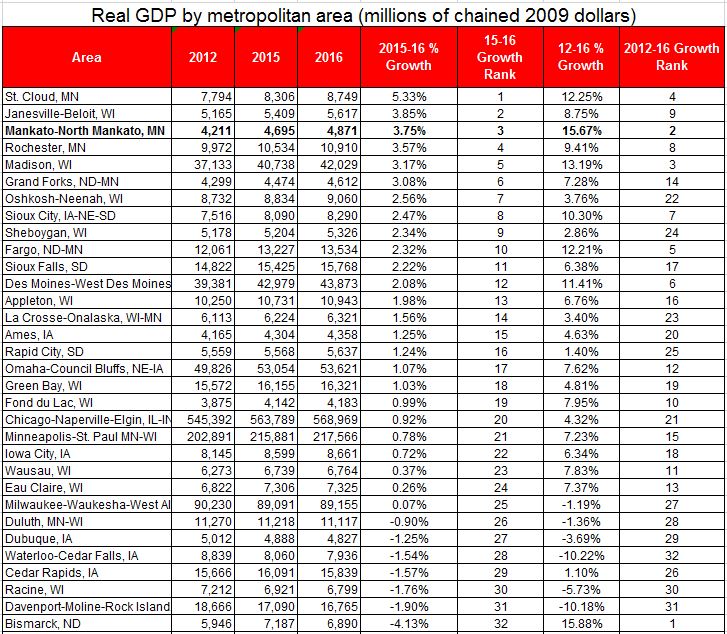
The Mankato-North Mankato Metropolitan Statistical Area (MSA), comprised of Blue Earth and Nicollet Counties, grew by 3.75% from $4.69 billion to $4.87 billion.
From 2015 to 2016, Mankato-North Mankato ranked 3rd among the 32 MSAs in the Upper Midwest (MN, IA, WI, SD, ND) in growth of Real GDP. “Real GDP” takes into account inflation.
Since 2012, Mankato-North Mankato ranks 2nd in the Upper Midwest with a growth rate of 15.67%.
Our MSA “doubled-up” the national growth rate over the last year (2015-2016) and nearly did the same over the last 5 years (2012-2016). The national rate growth rate was 1.67% from 2015-16 and 8.58% from 2012-2016.
Mankato-North Mankato’s growth was fueled by growth in the Real Estate Market (39.6% growth from 2015 to 2016).
Below is a table outlining the growth of Upper-Midwest MSAs. A couple of items of note:
- Bismark, ND ranked lowest over the last year with a DECLINE of 4.13%. However they are the only MSA ahead of Mankato-North Mankato over the last 5 years (2012-2016). This is an indication of an unstable economy subject to booms and bust, versus stable and methodical economic growth of the diversified economy in our MSA.
- 3 of the Top 5 MSAs over the last year were in Minnesota
- Over the last 5 years, Mankato-North Mankato has the strongest economy in Minnesota.