اقتصادنا

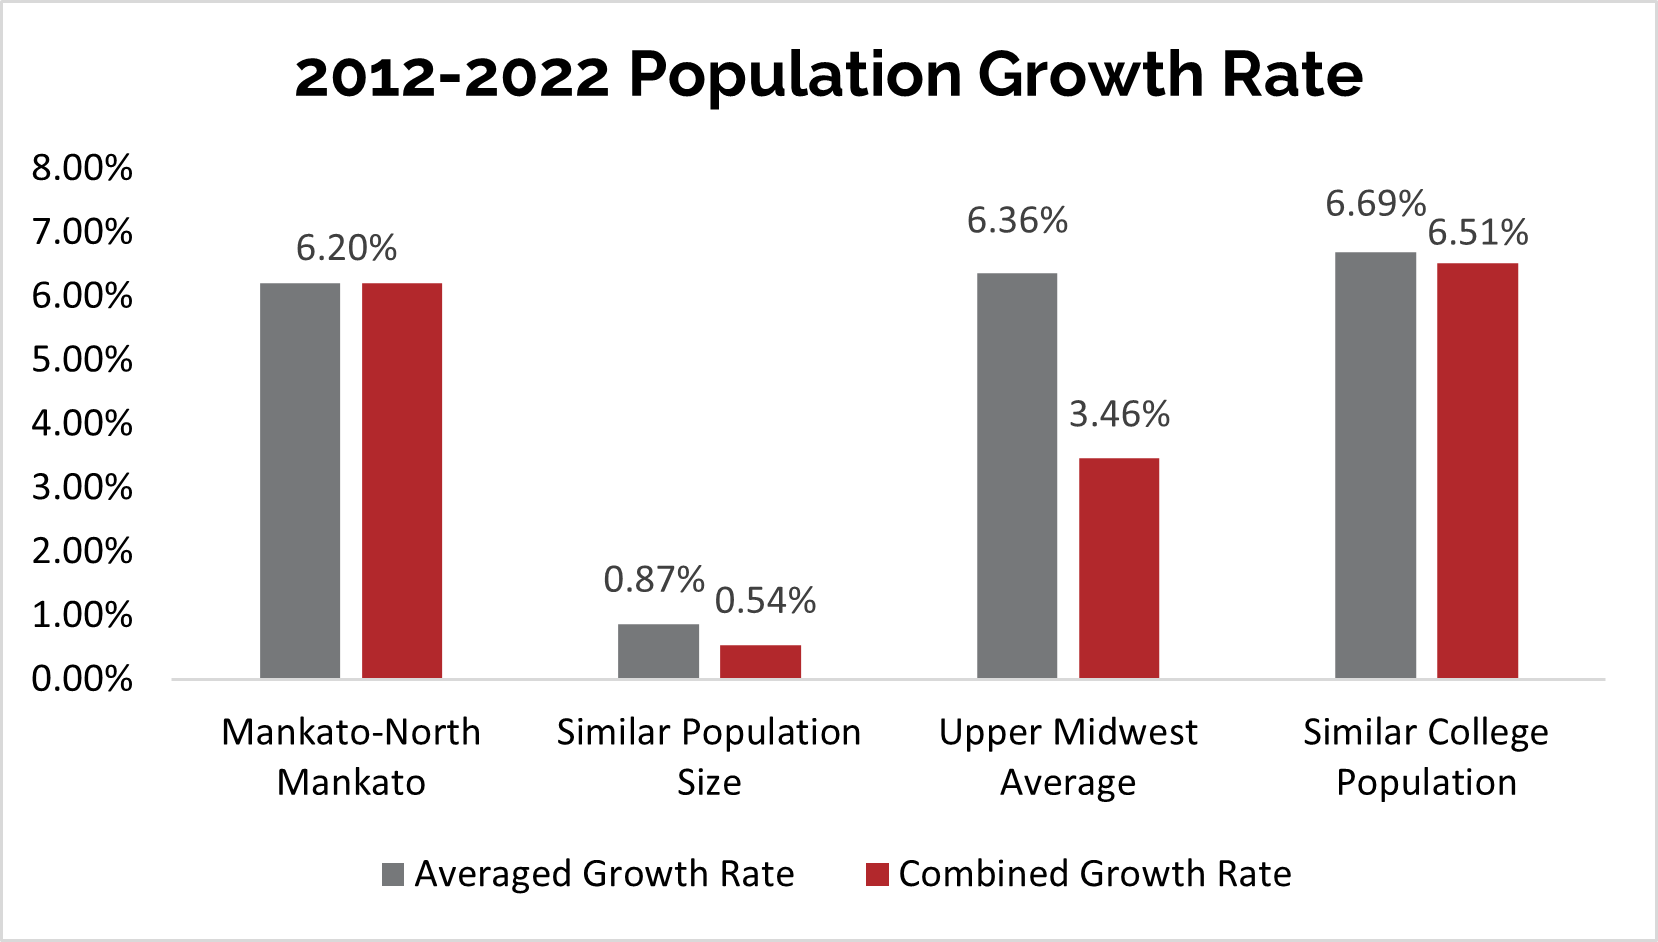
Population 2012-2022 Growth Rate

The Mankato-North Mankato ranks well when comparing our community to others with a similar population, communities with a similar college-aged population, and other communities across the Midwest.
Economy

The Mankato MSA has had steady population growth since 2012.  In the 10-year period between July 2012and July 2022, the population of the Mankato MSA grew by 6.2%.  This exceeded the combined growth rate of the 32 MSAs in the upper Midwest (MN, ND, SD, IA, WI) by 3.46%.  Over the same 10-year period, communities with a similar college-aged population exceeded this, growing by 6.51%; however, those communities had an average population almost double (194,847) than that of the Mankato MSA. MSAs of similar size population (the 10 just above and the 10 just below) grew by only 0.54%.

For the full report and a detailed look at Mankato-North Mankato compared to communities of similar size, download the Greater Mankato Economic Report below – or review reports from prior years.

New and Expanding Businesses

Building and expansion activity continues to be strong in Greater Mankato. For details on these projects, download our construction investment report in Greater Mankato. It provides a breakdown for the past five years and details by industry sector: primary (manufacturing, distribution, processing), professional services (attorneys, accounting, consulting), retail (restaurants, clothing, boutiques). It also provides data for government and education investments broken into investments for specific projects and infrastructure investments. 

Greater Mankato Growth tracks construction investment into commercial projects based on building permit data as well as public infrastructure & project investment. Investments not requiring building permits and housing development that is not mixed use is not captured in these reports.


Greater Mankato Construction Investment

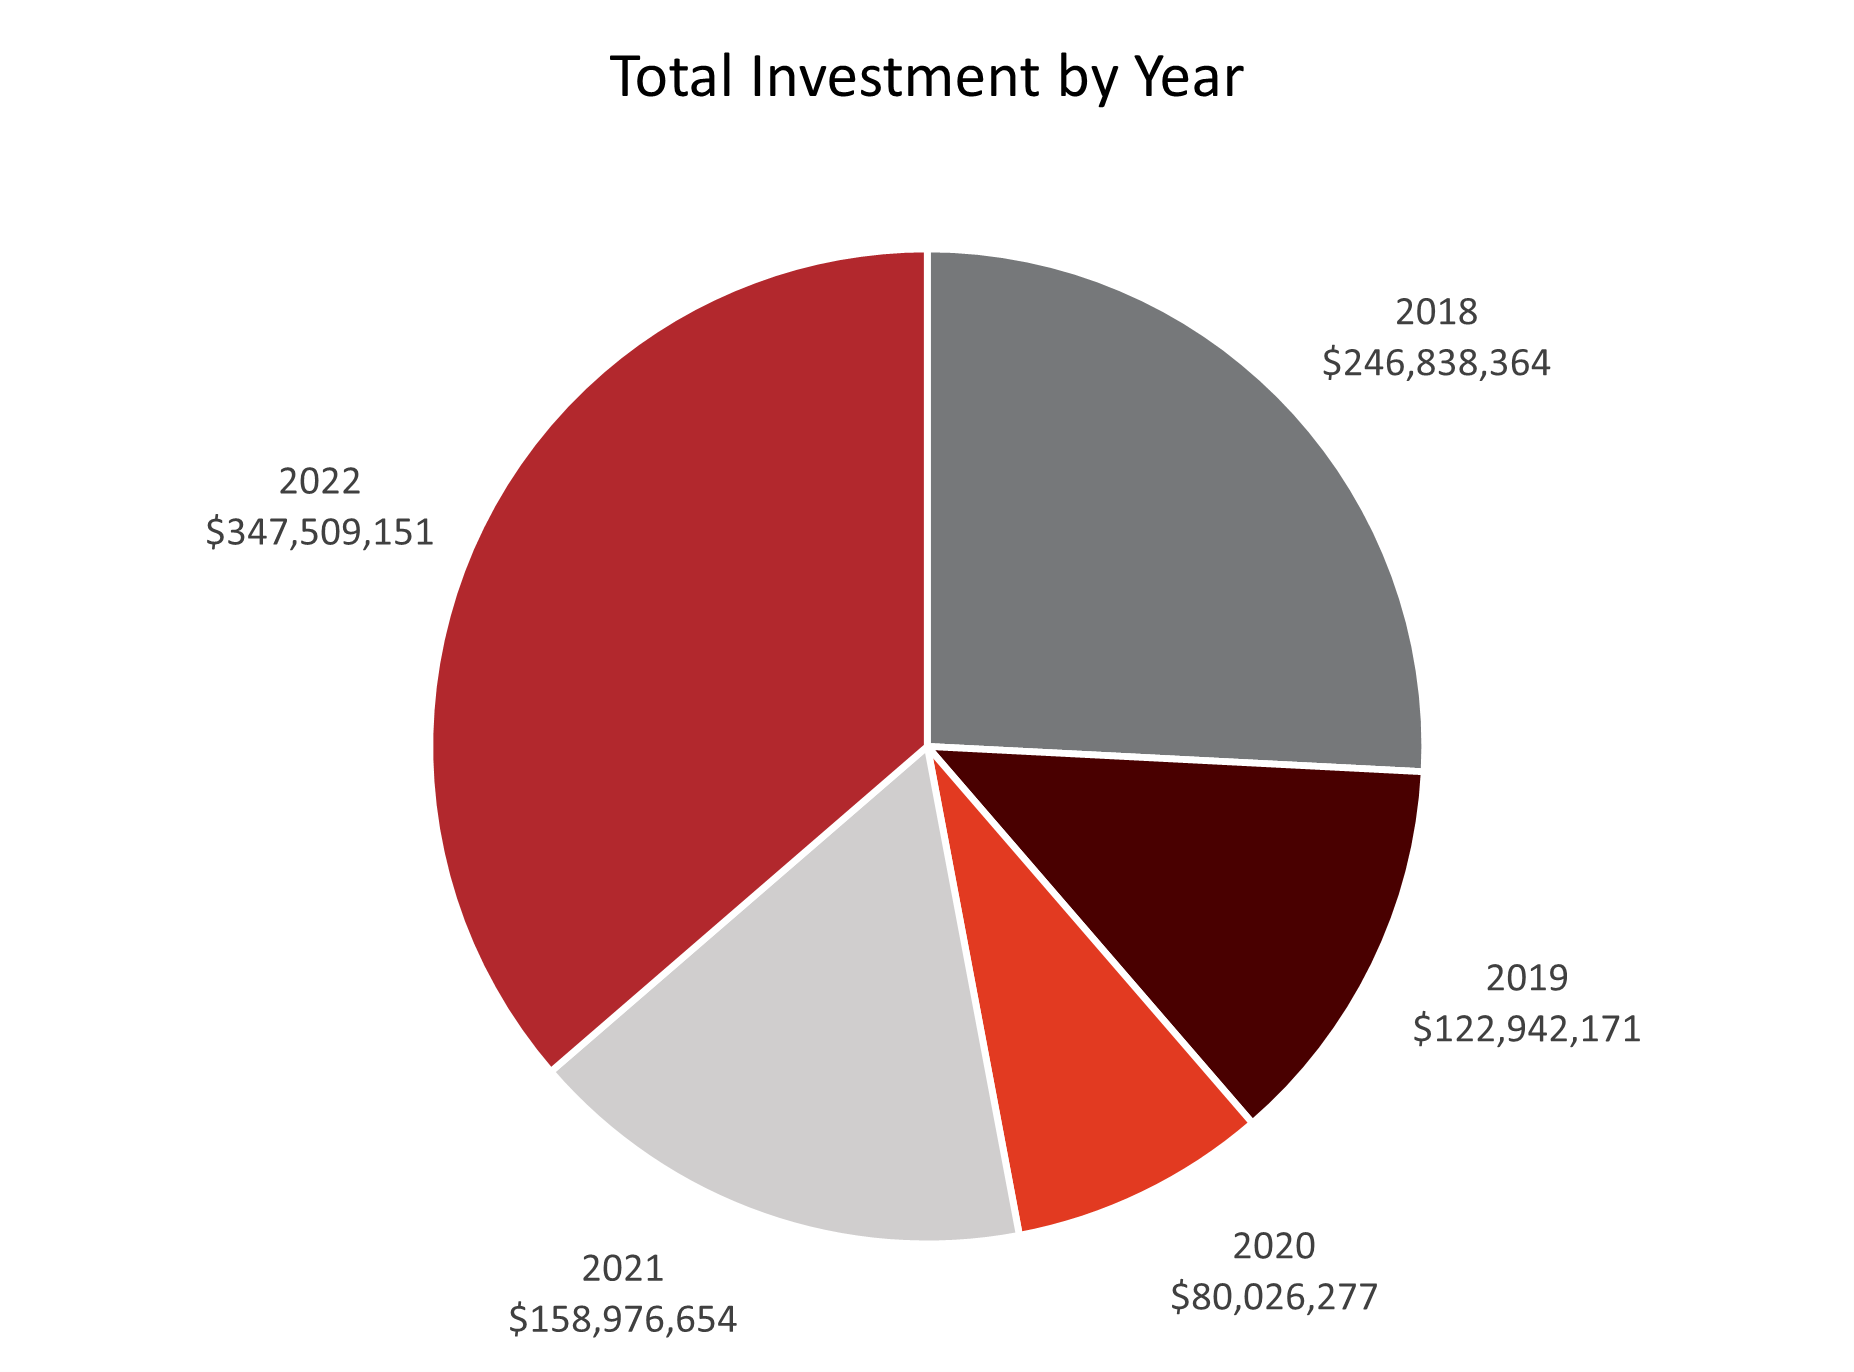
The following charts and graphs illustrate business & development investments occurring between 2018 and 2022. The consolidated report gives a detailed listing of projects within this timeframe or view reports for individual years. 

Highlights from 2017-2021 Business Pipeline Consolidated Report:
Previous slide
Next slide
Historical Investment

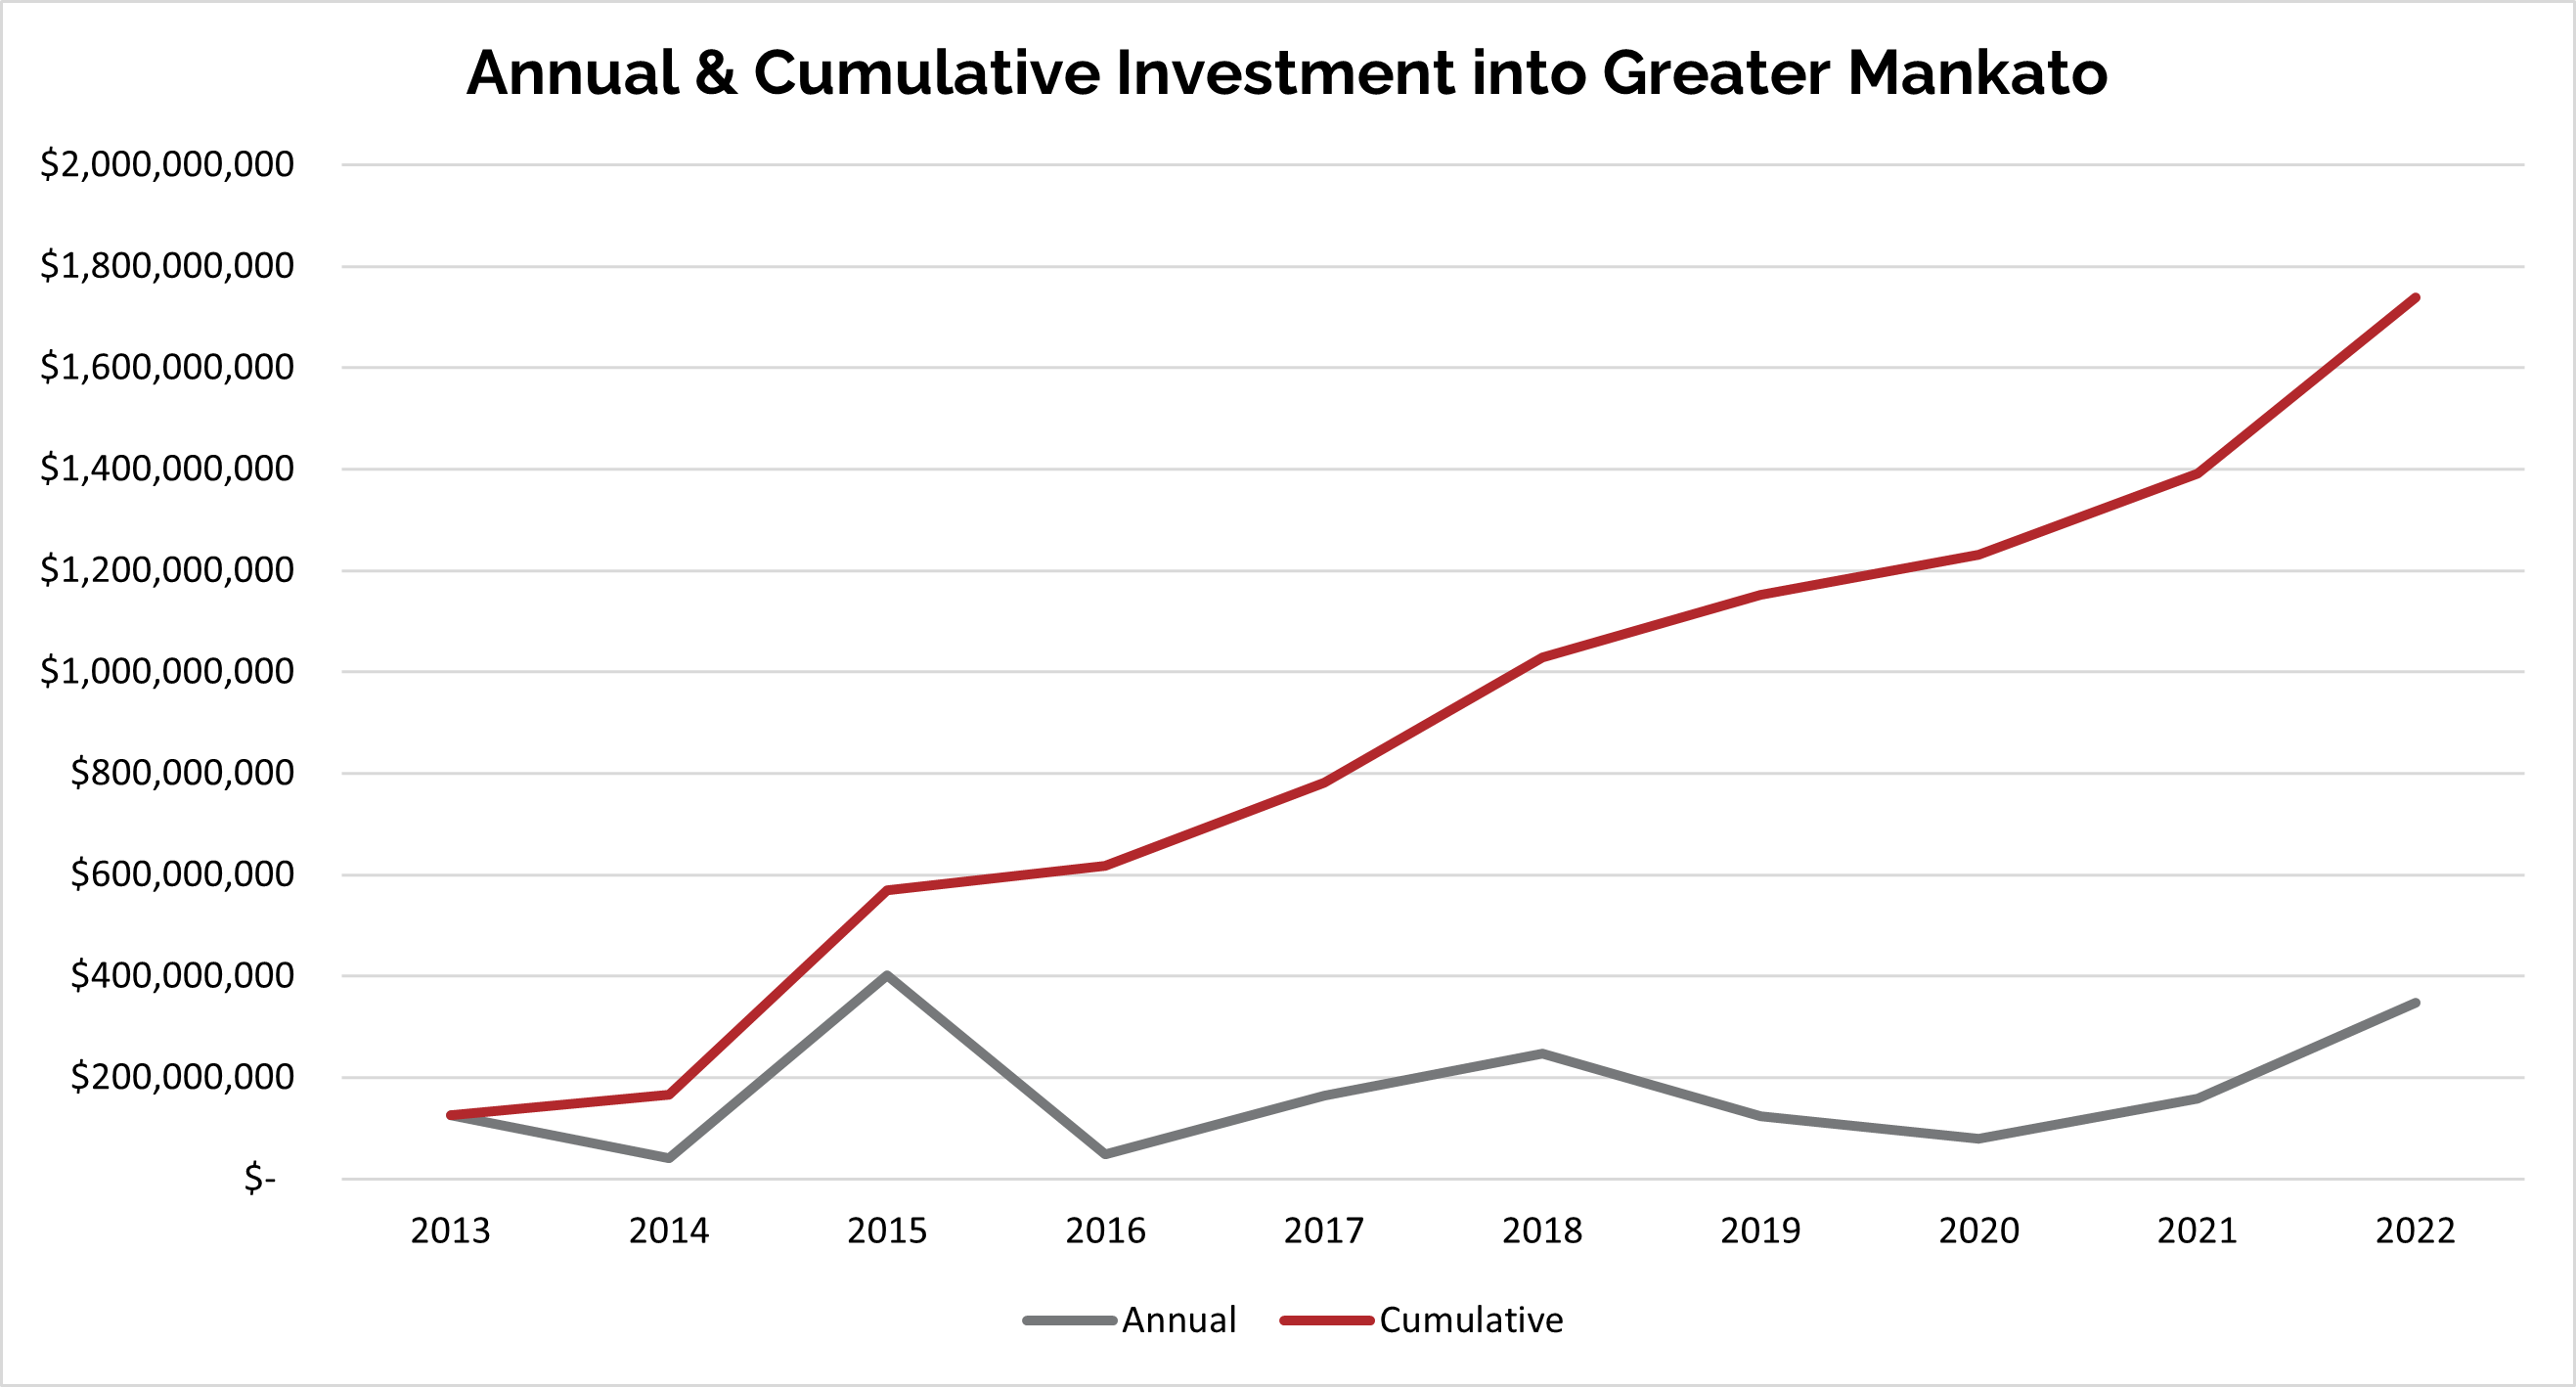
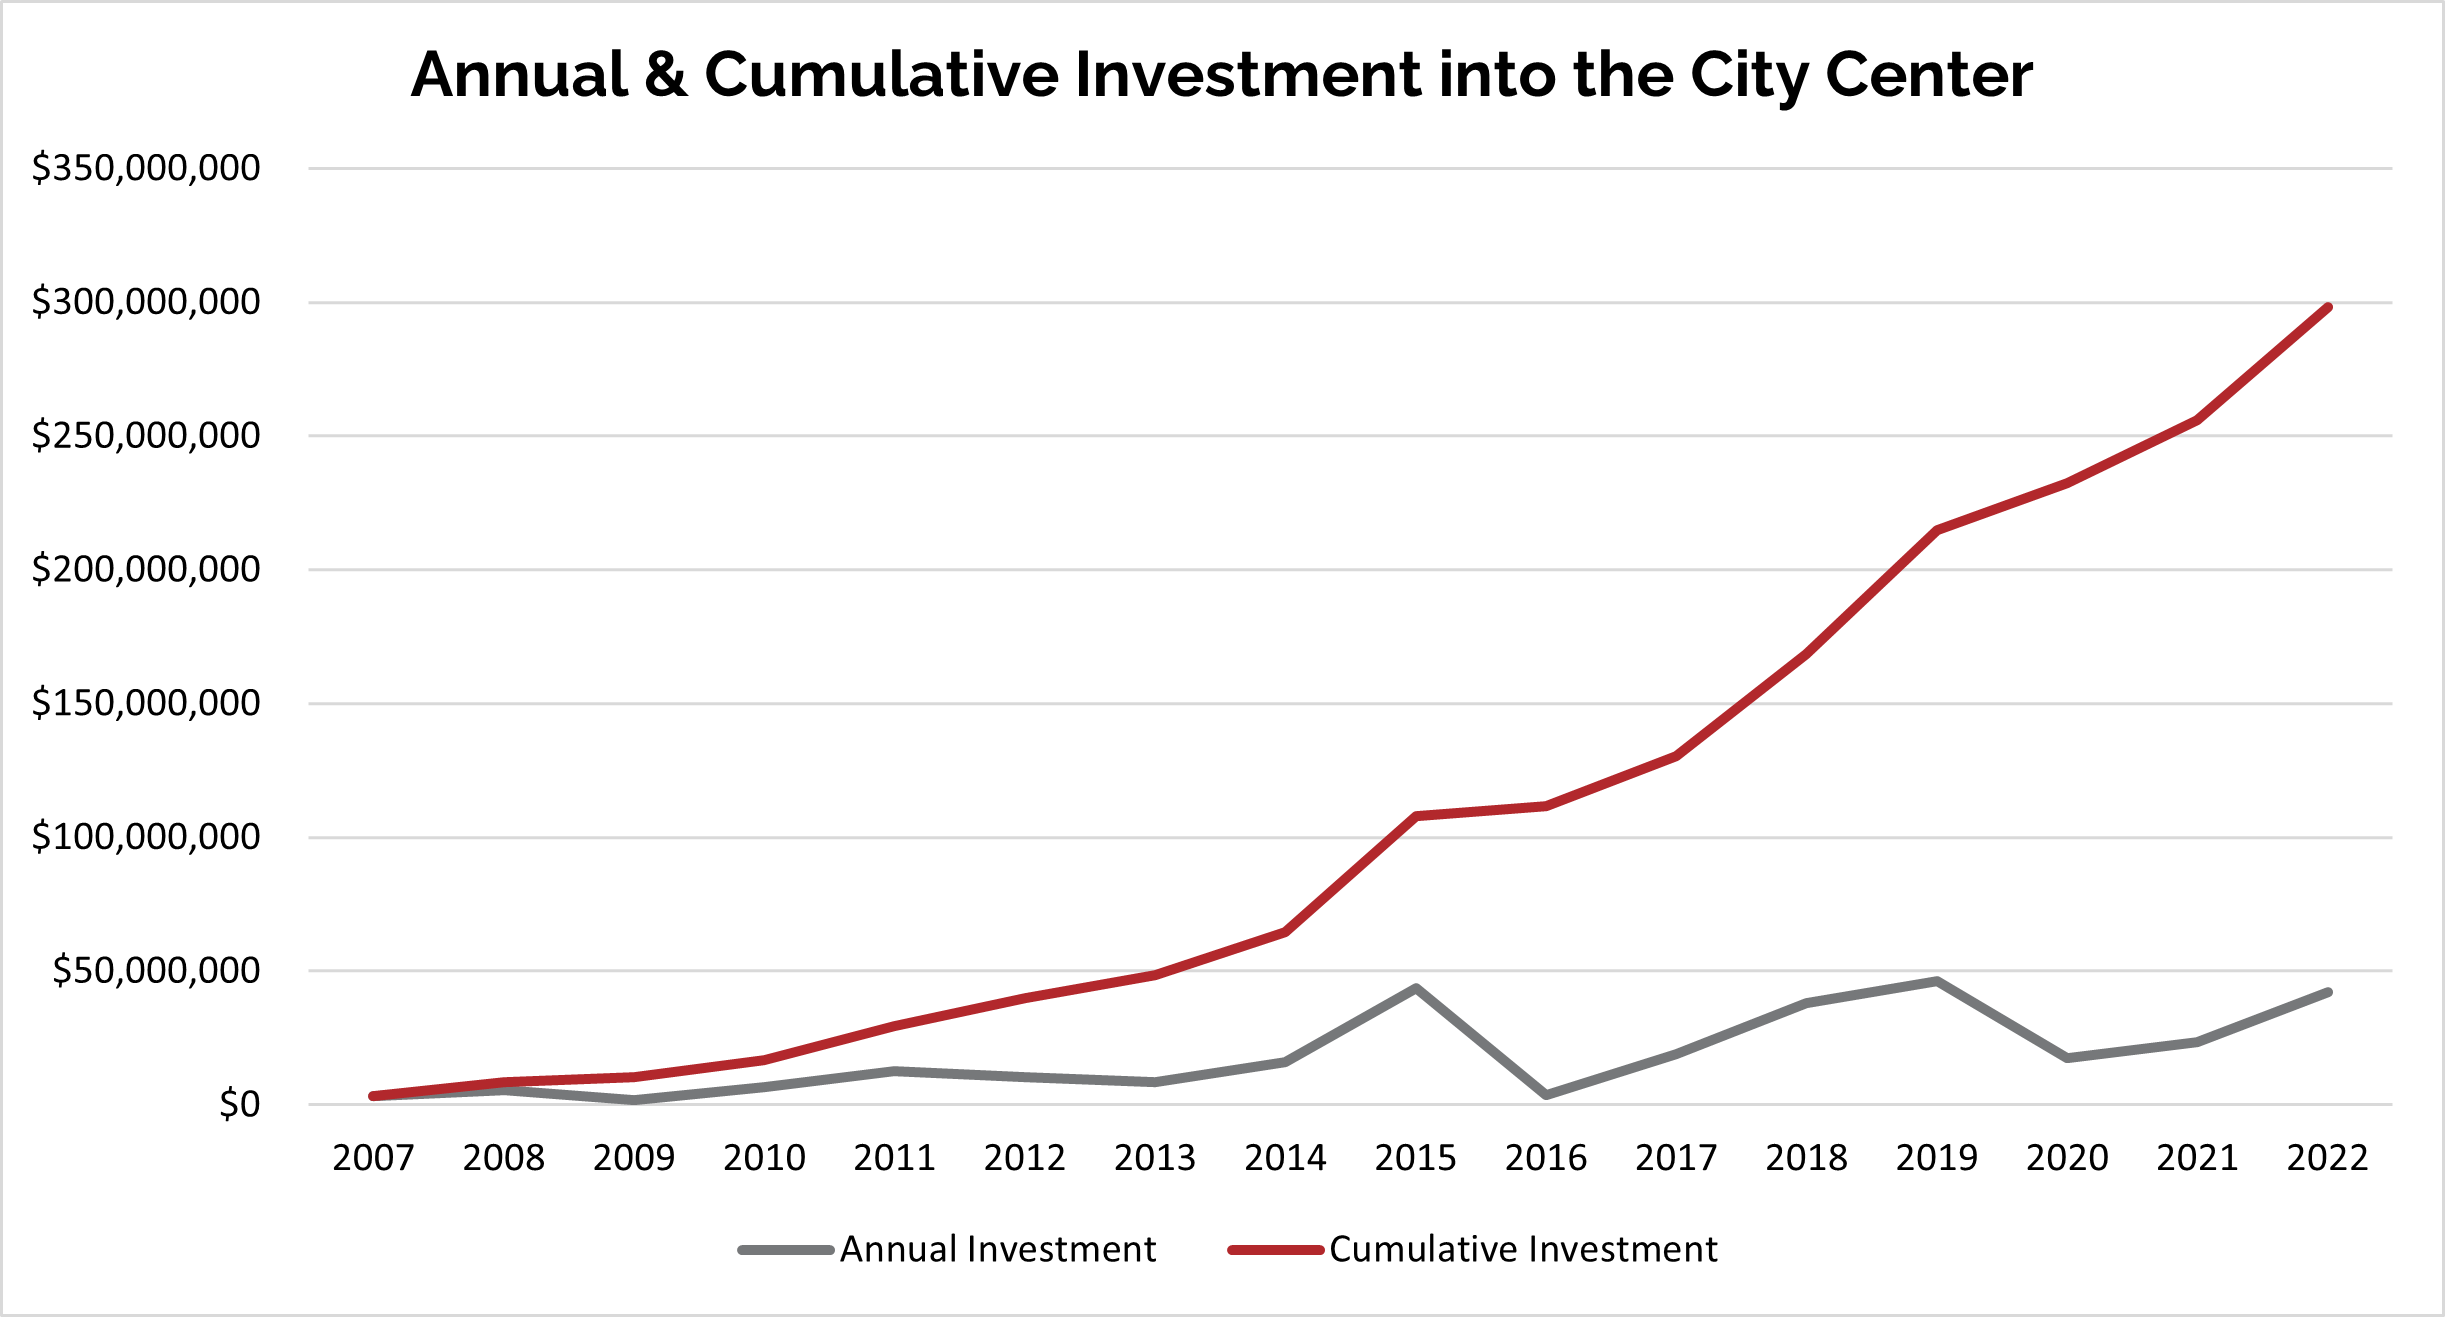
Following the 2022Pipeline Report, Greater Mankato’s 10-year investment rose to $1.7 billion. Greater Mankato’s City Center Investment since 2007 is just shy of $300 million.

Industry Diversification

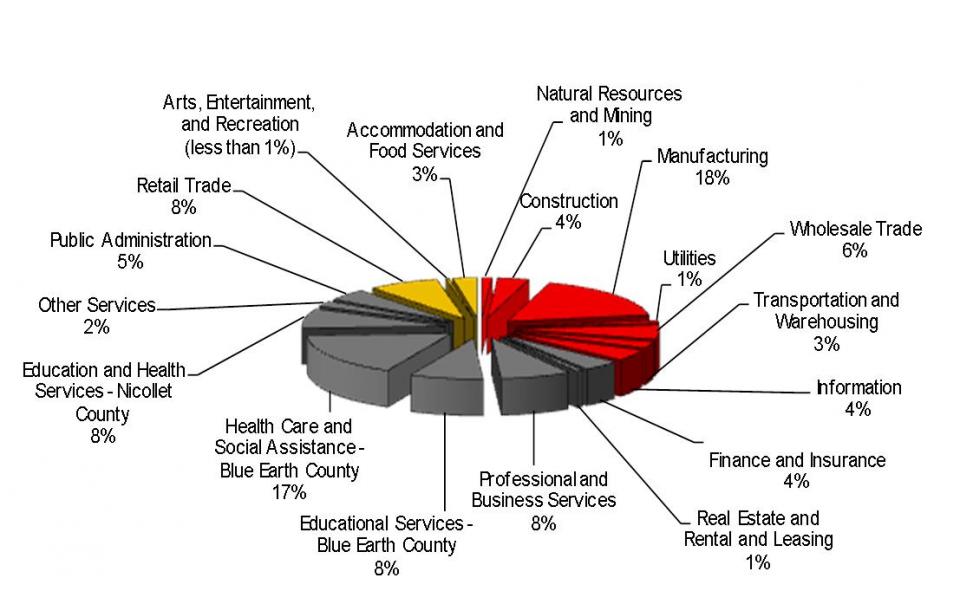
Greater Mankato’s general economic makeup is highly diversified, with approximately 36% Primary Economy, 53% Professional/Service Economy and 11% Retail/ Consumer Economy. Even within these areas, the economy is diversified, with no sector accounting for more than 18% of the overall economy.

arالعربية