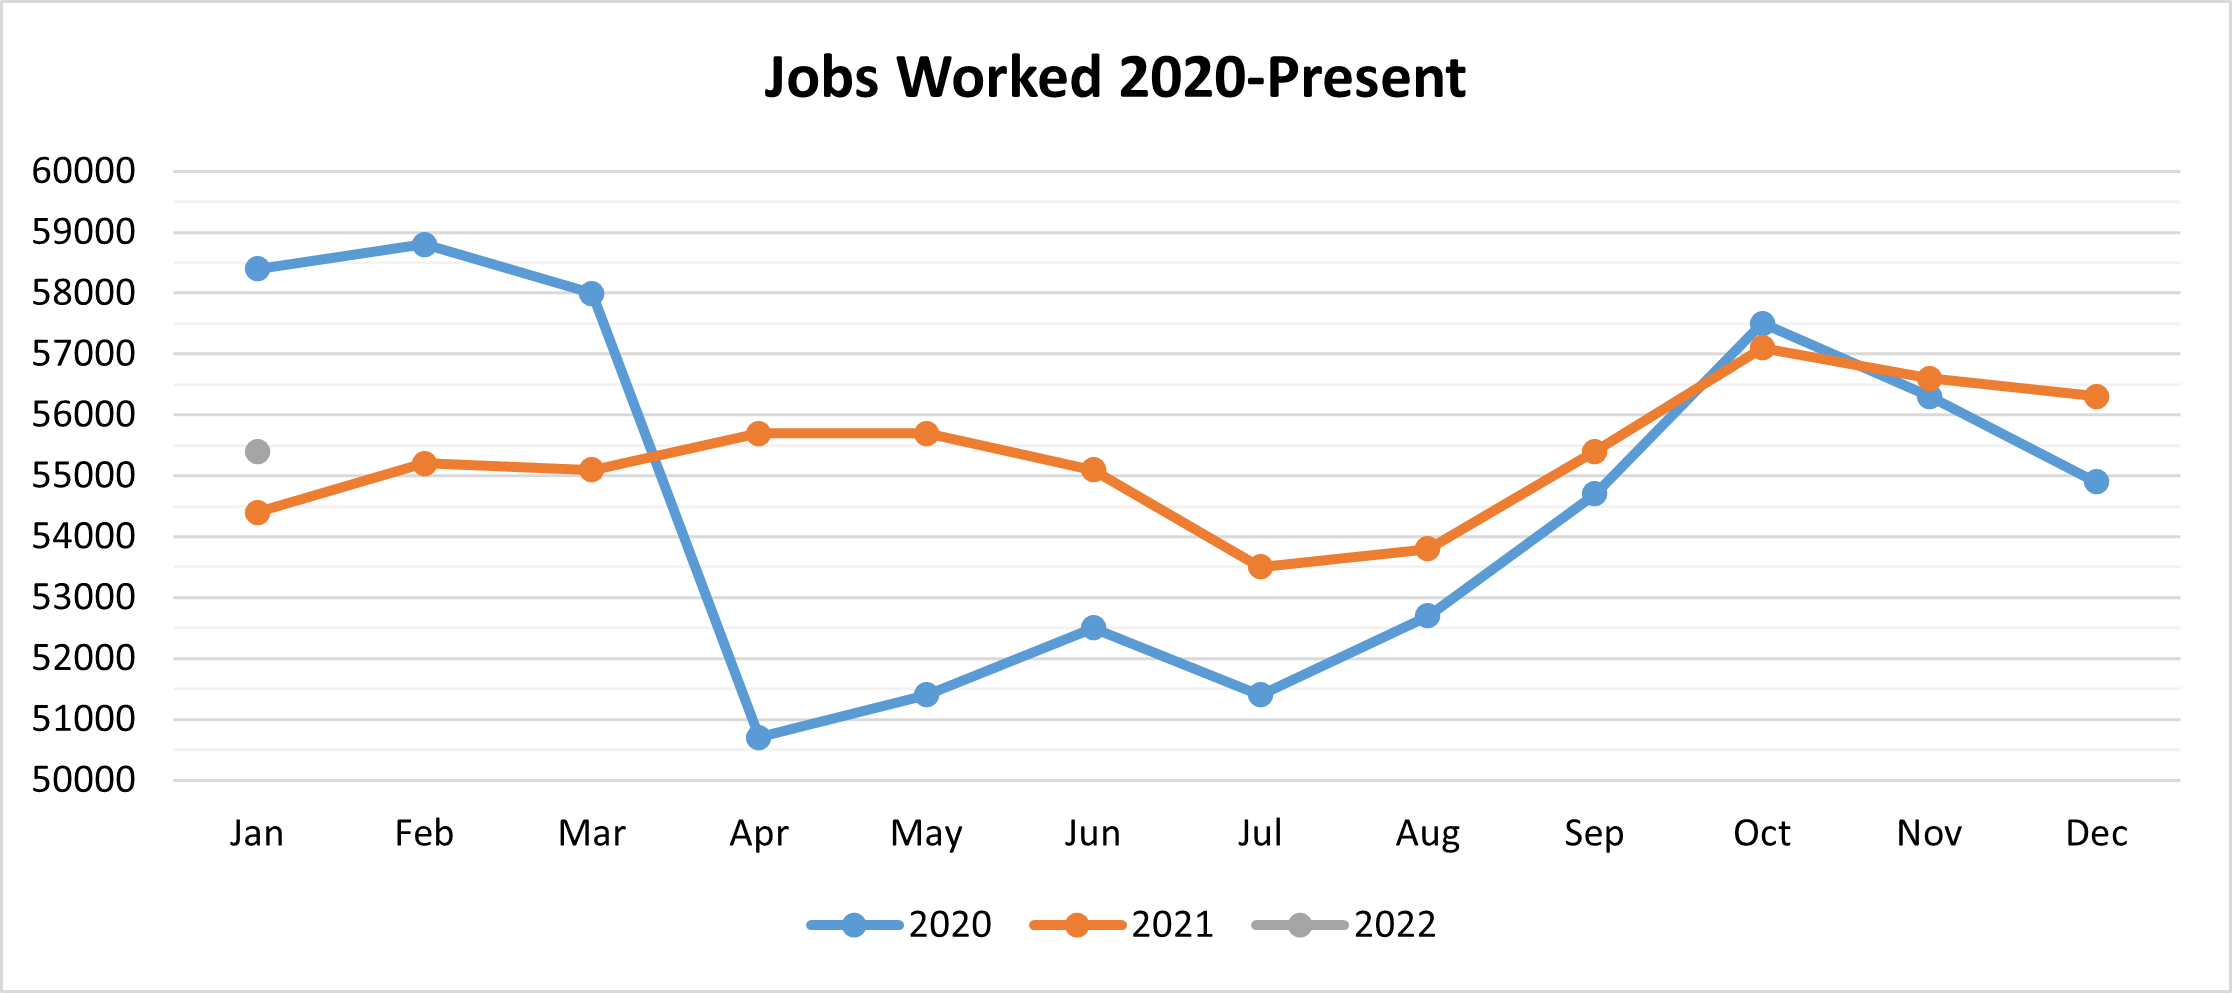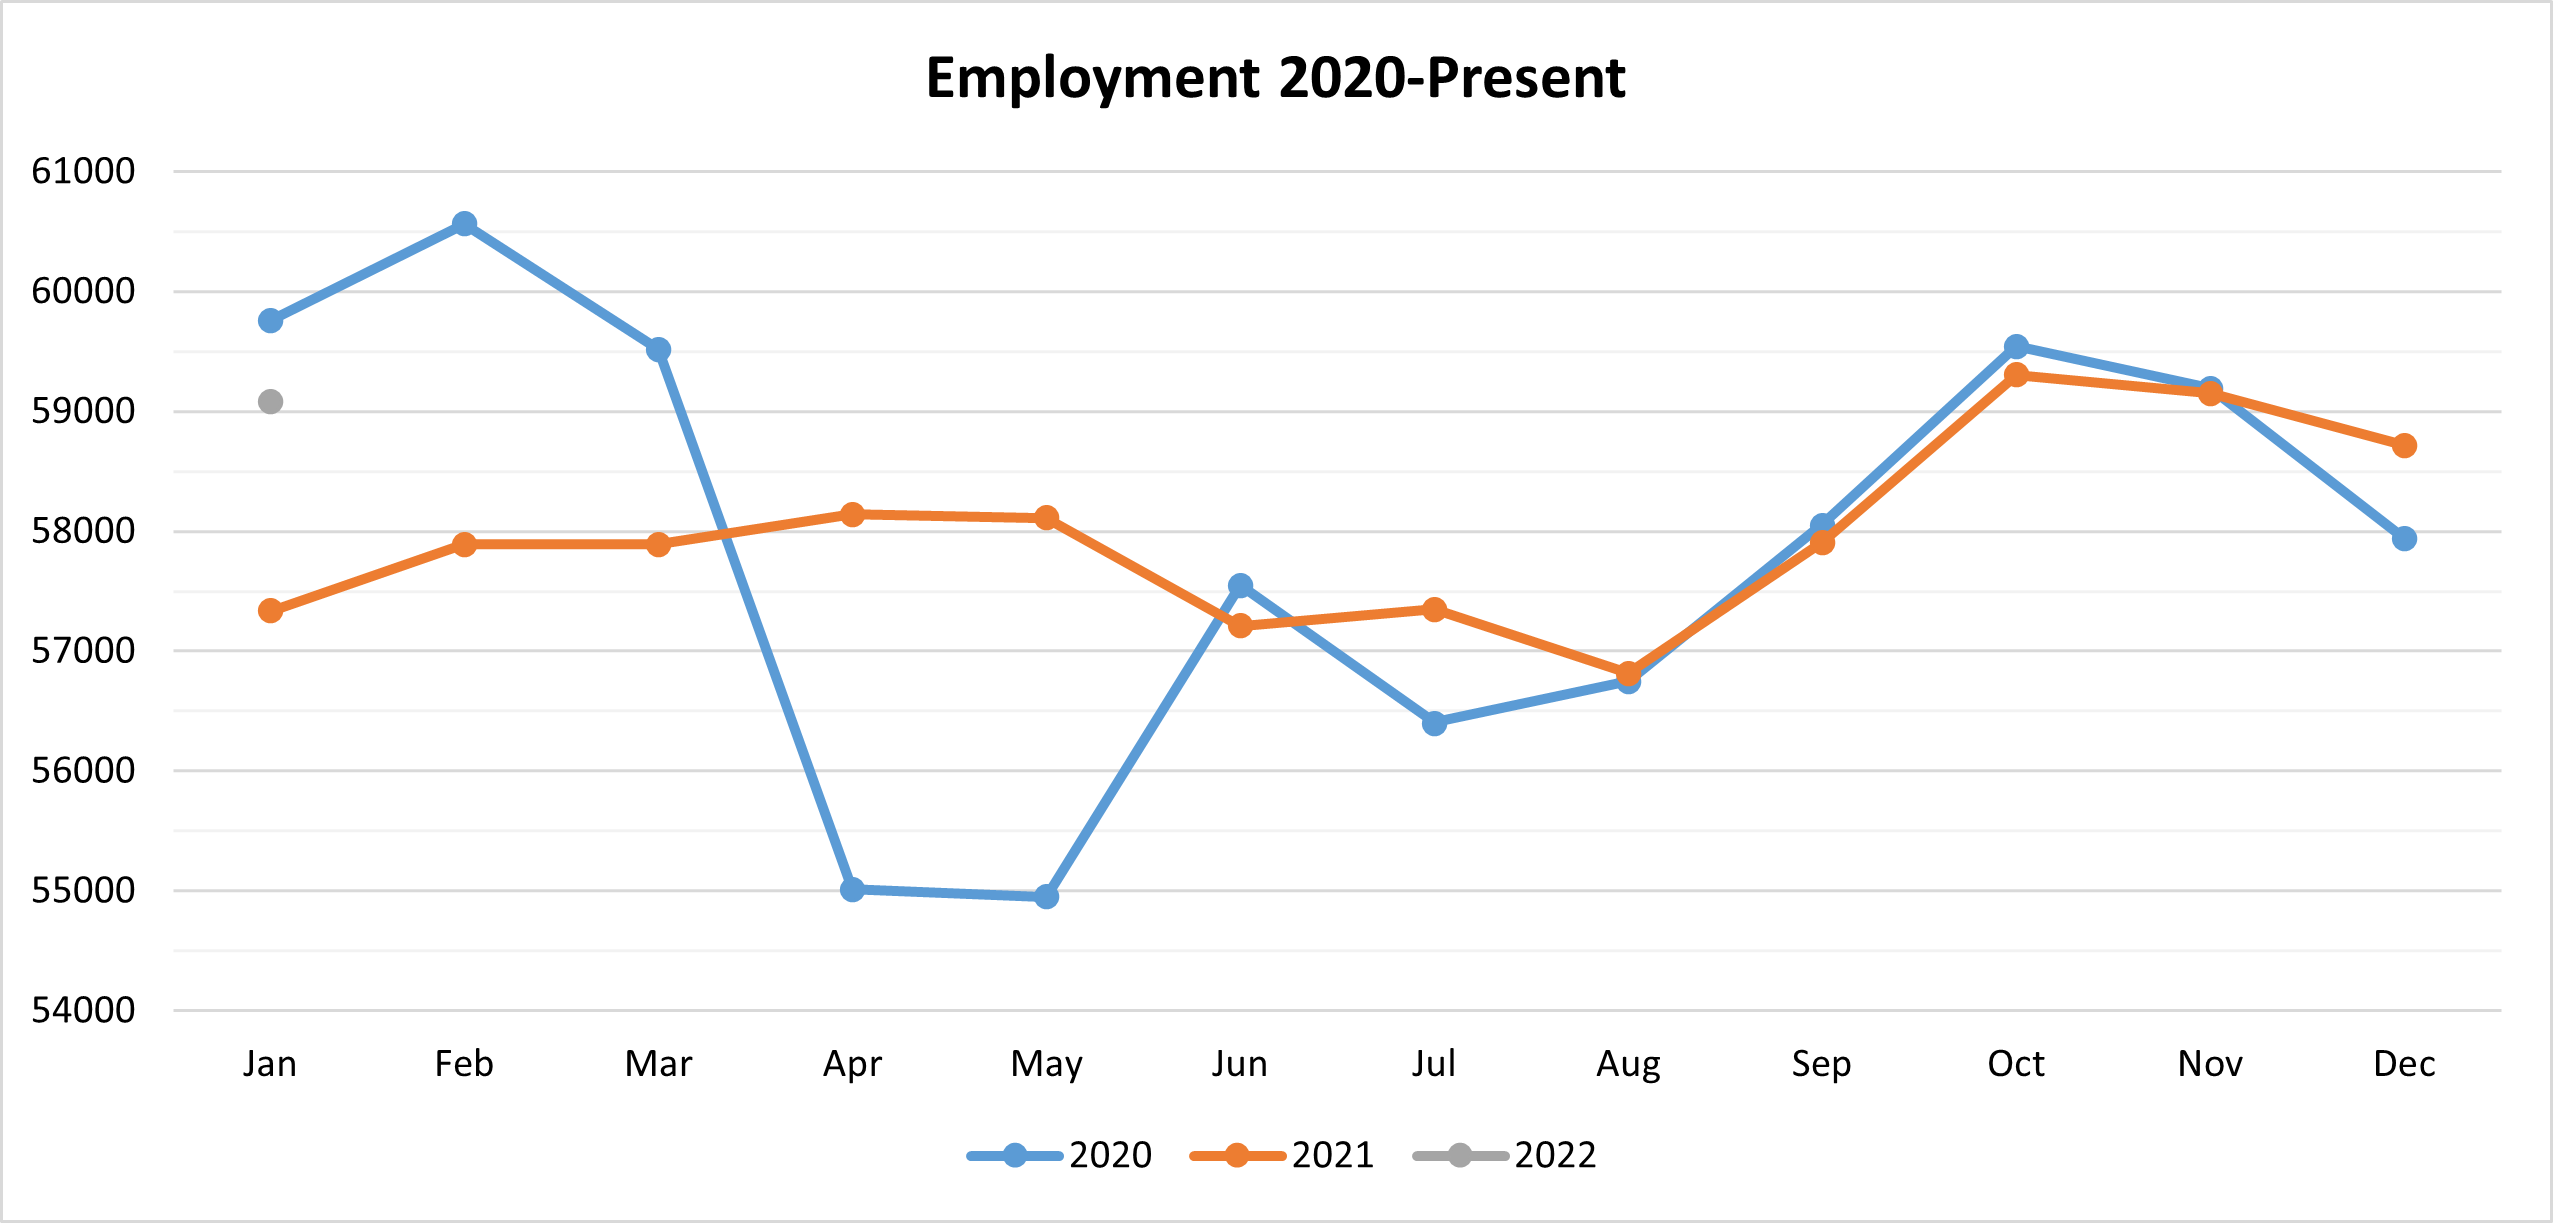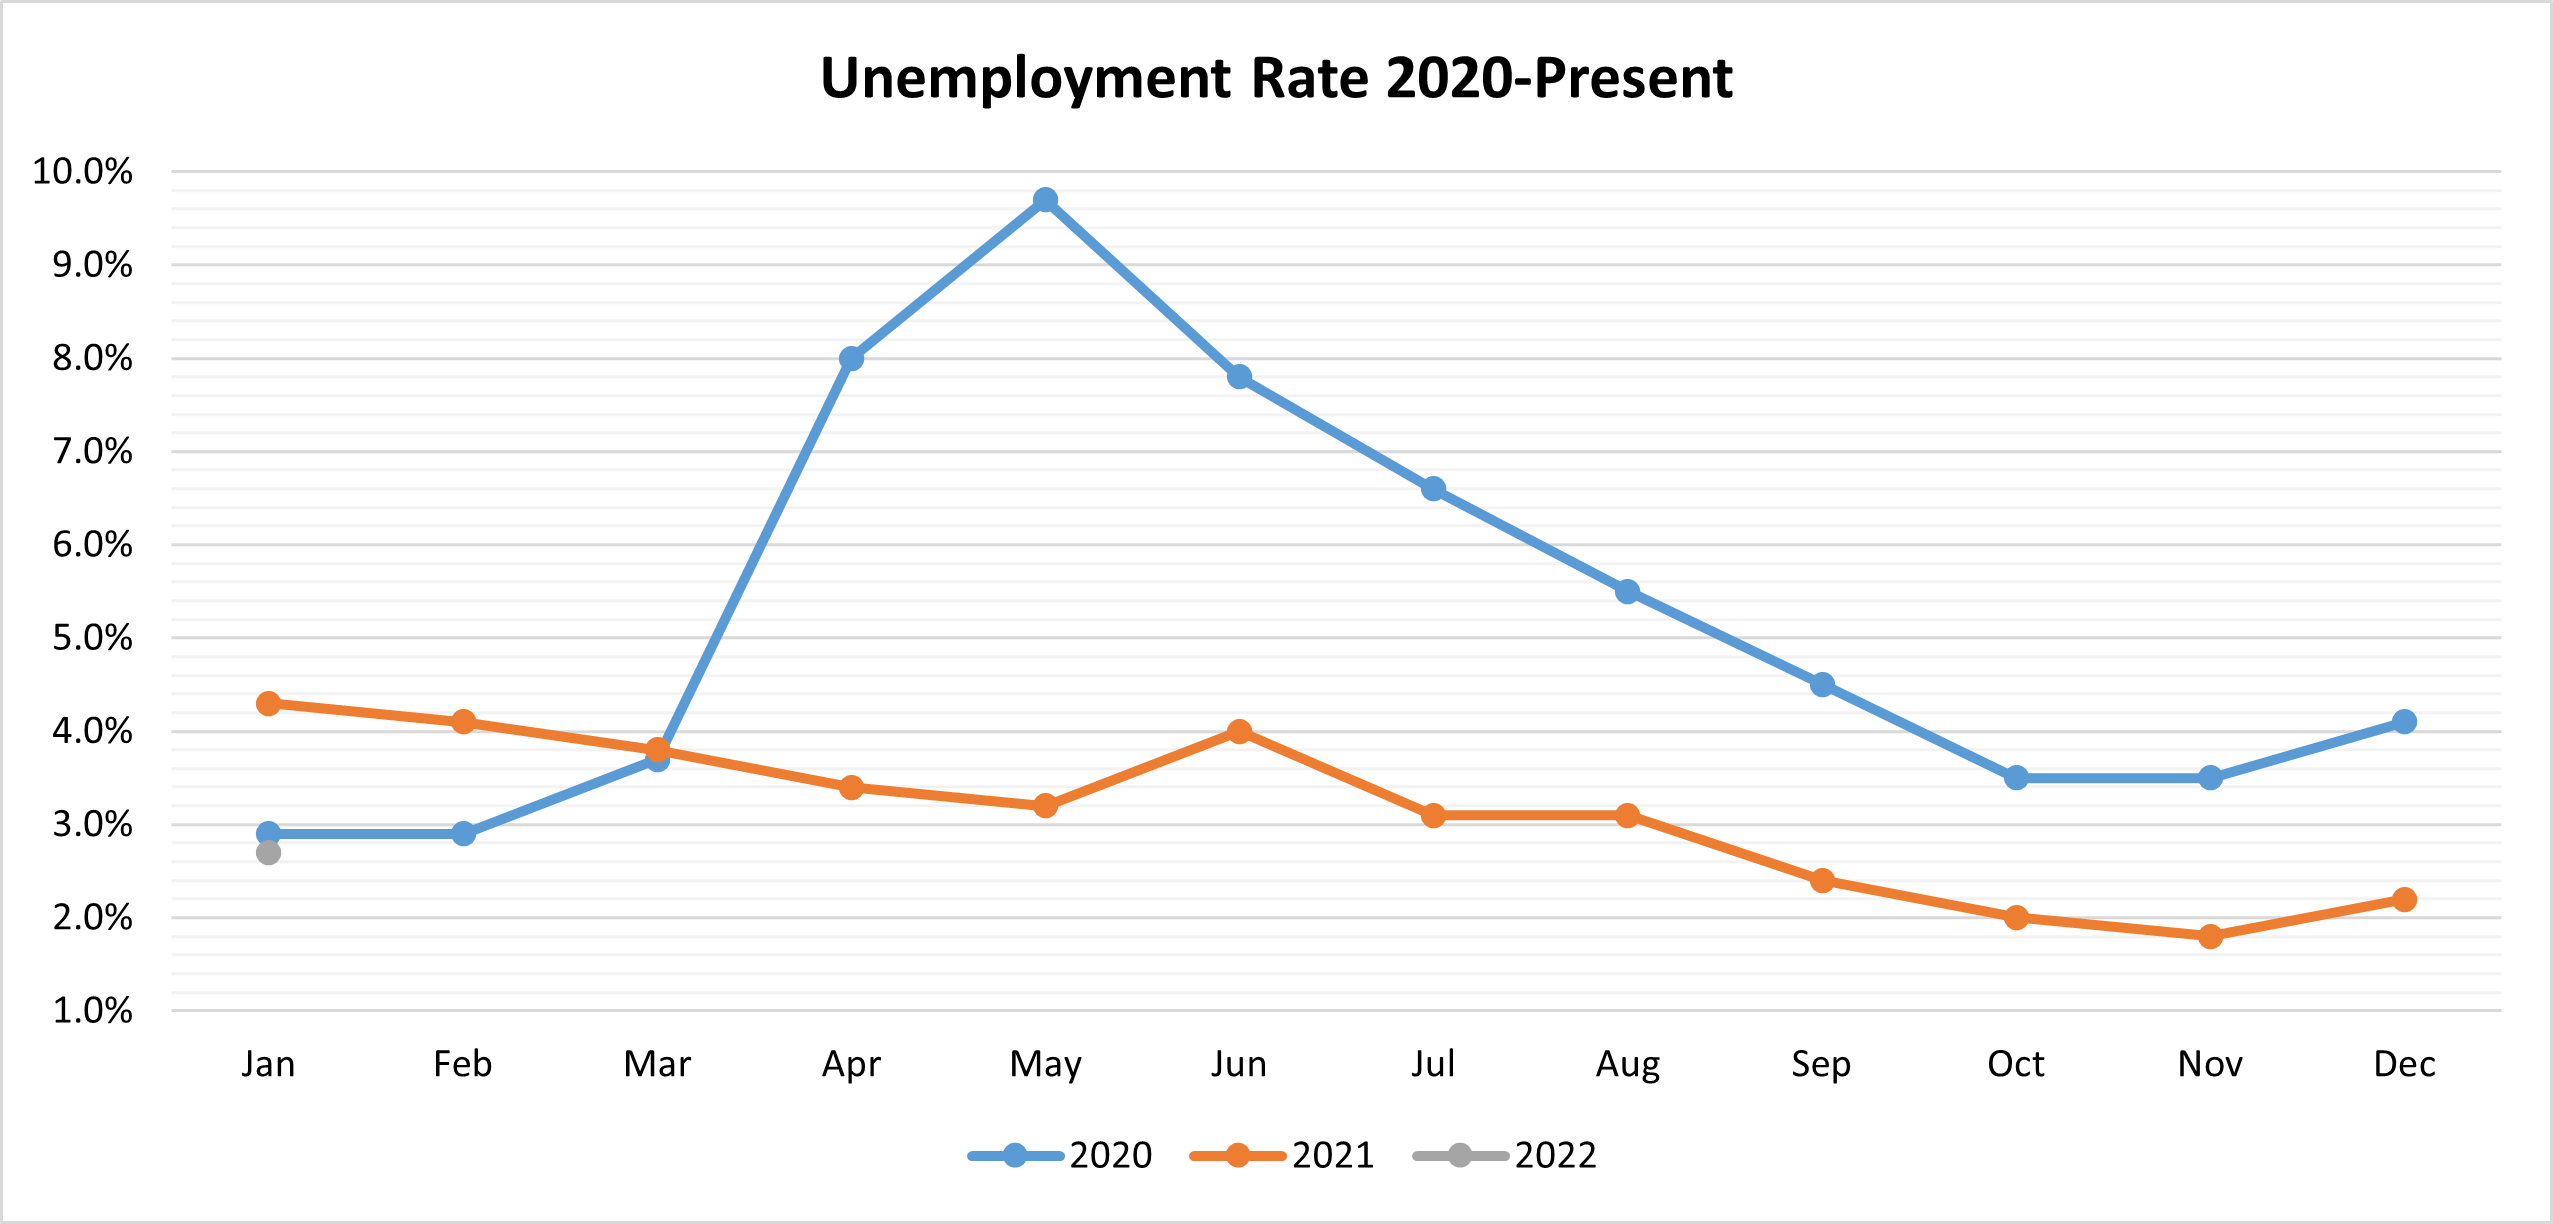
The Bureau of Labor Statistics has released preliminary January data for their Local Area Unemployment Statistics (LAUS) and Current Employment Statistics (CES) reports. In these reports, we saw that the number of employed individuals living in the Mankato-North Mankato MSA rose by 366 while the number of jobs being worked (total nonfarm payroll) in our region dropped by 900 (information on the difference between employed individuals & jobs data can be found at the end of this blog post).
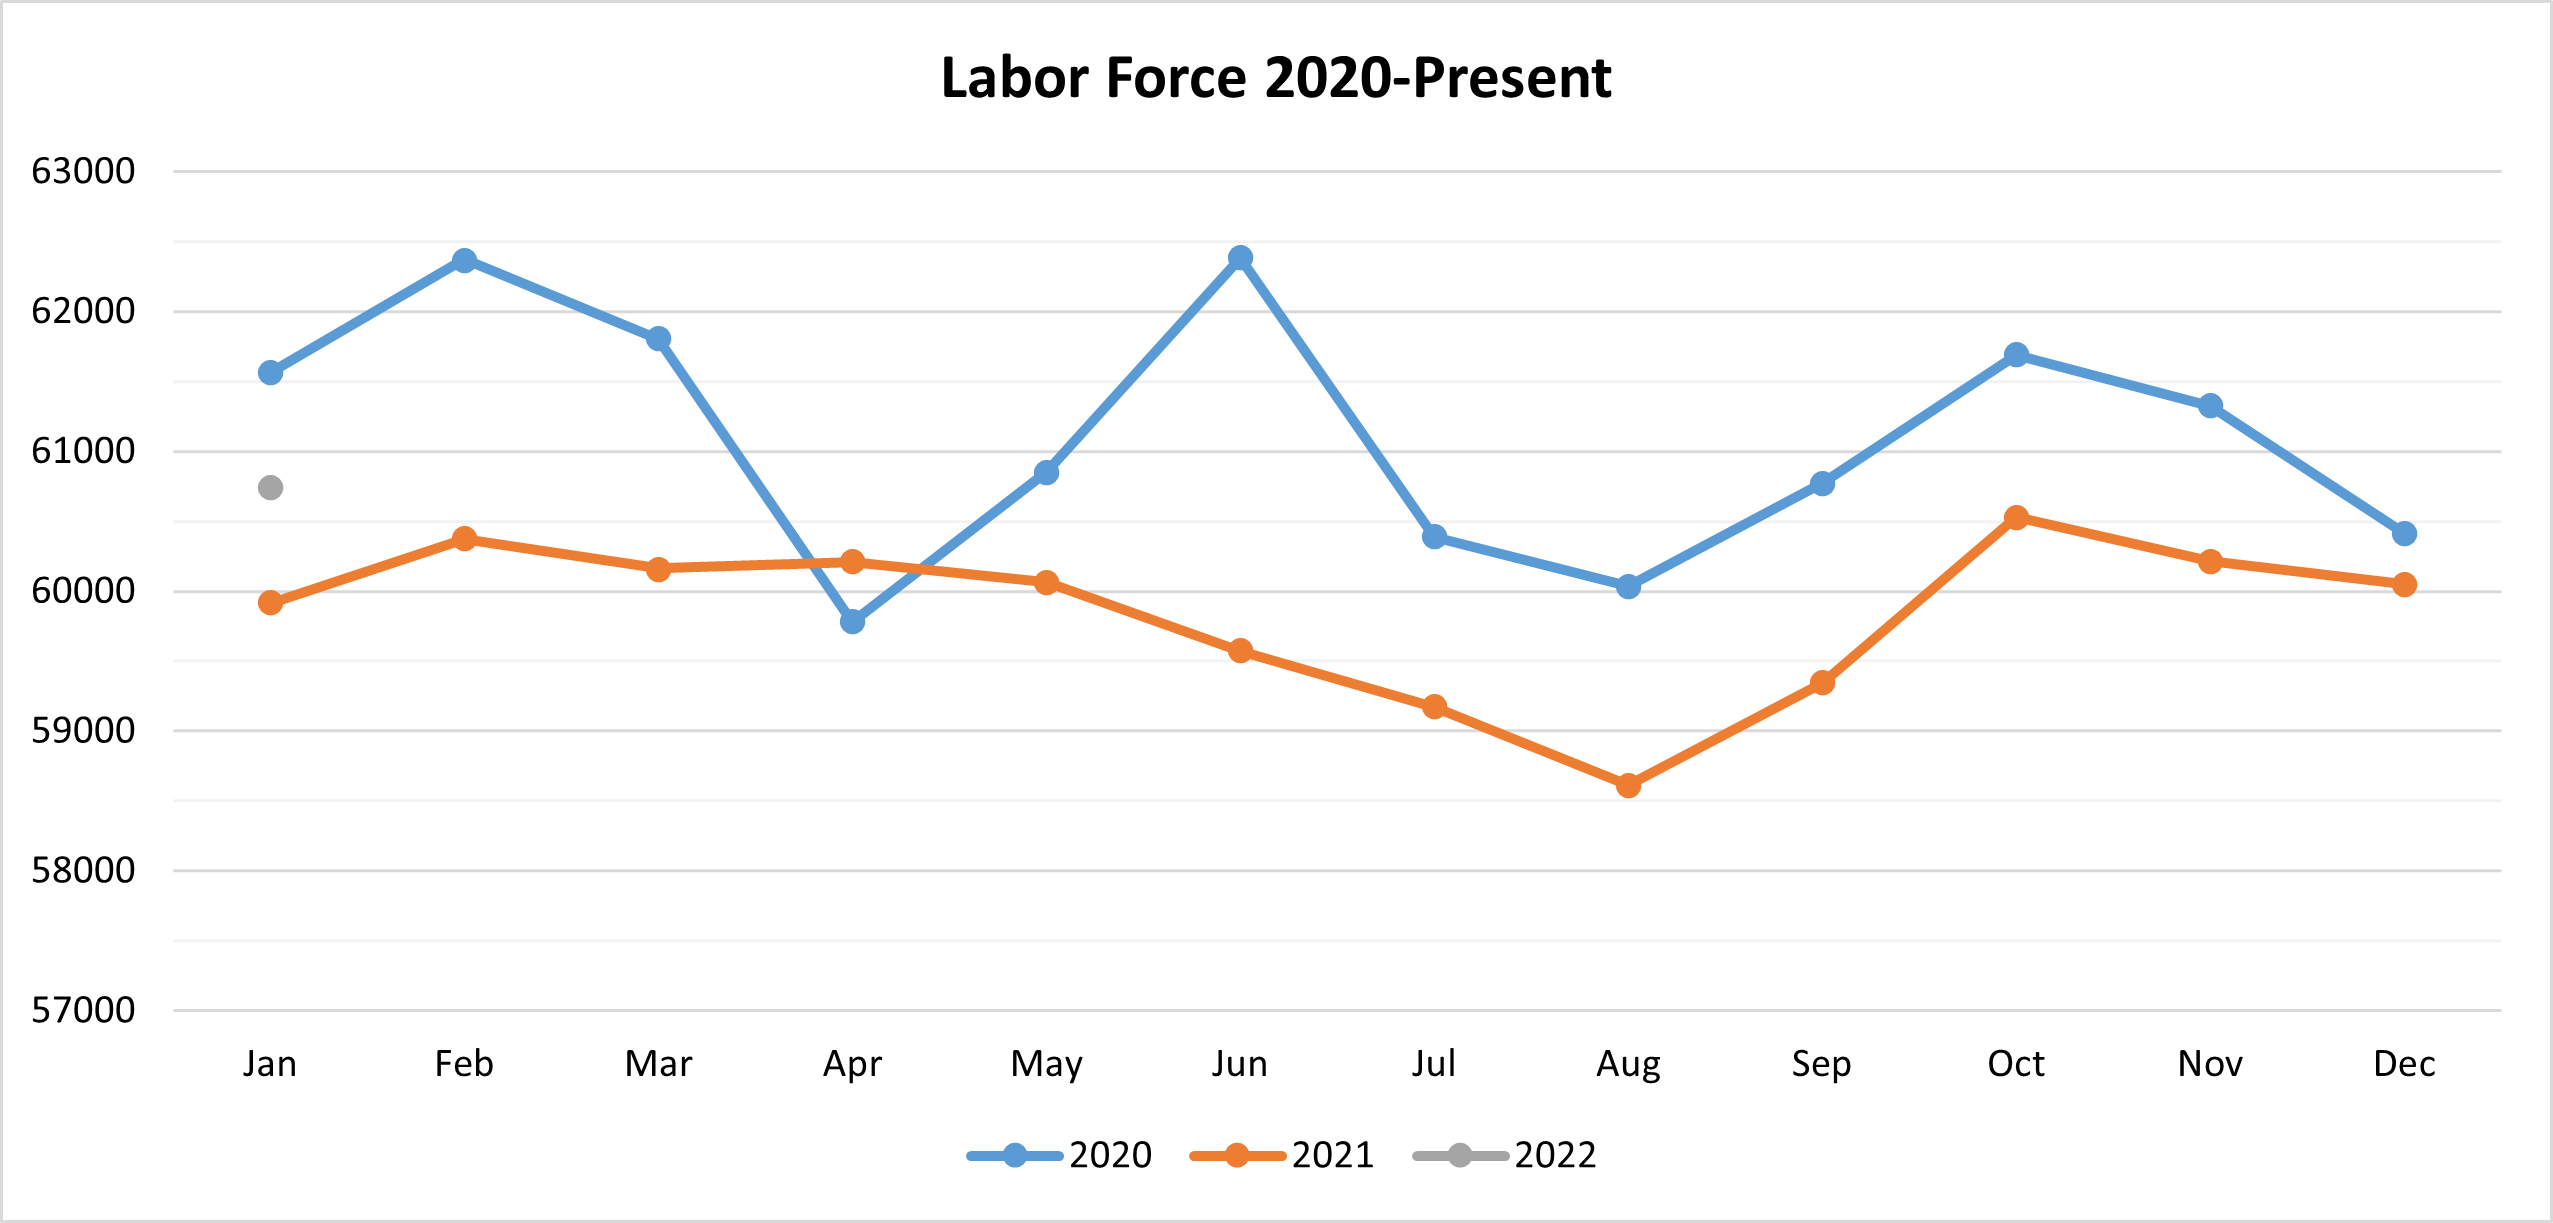
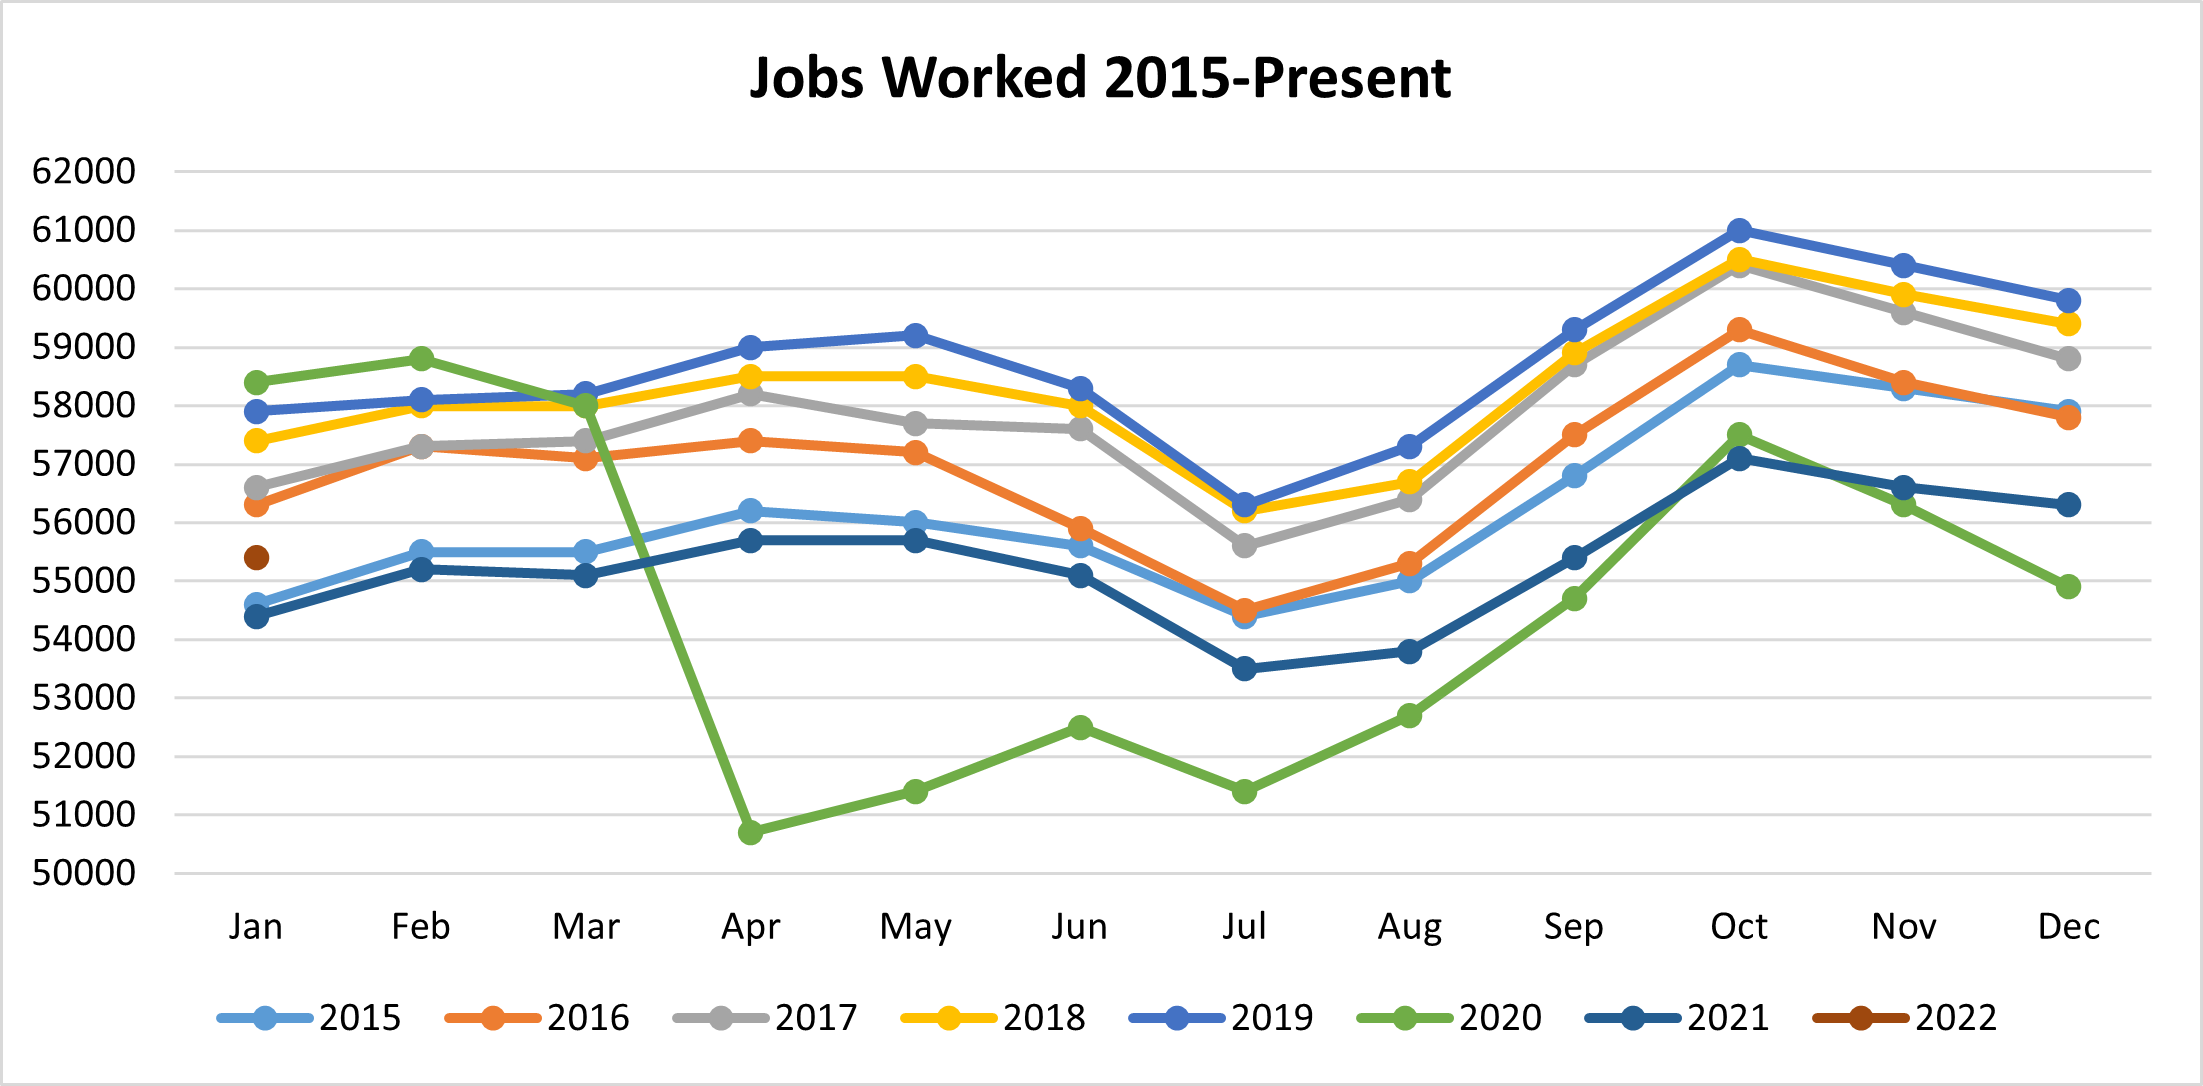
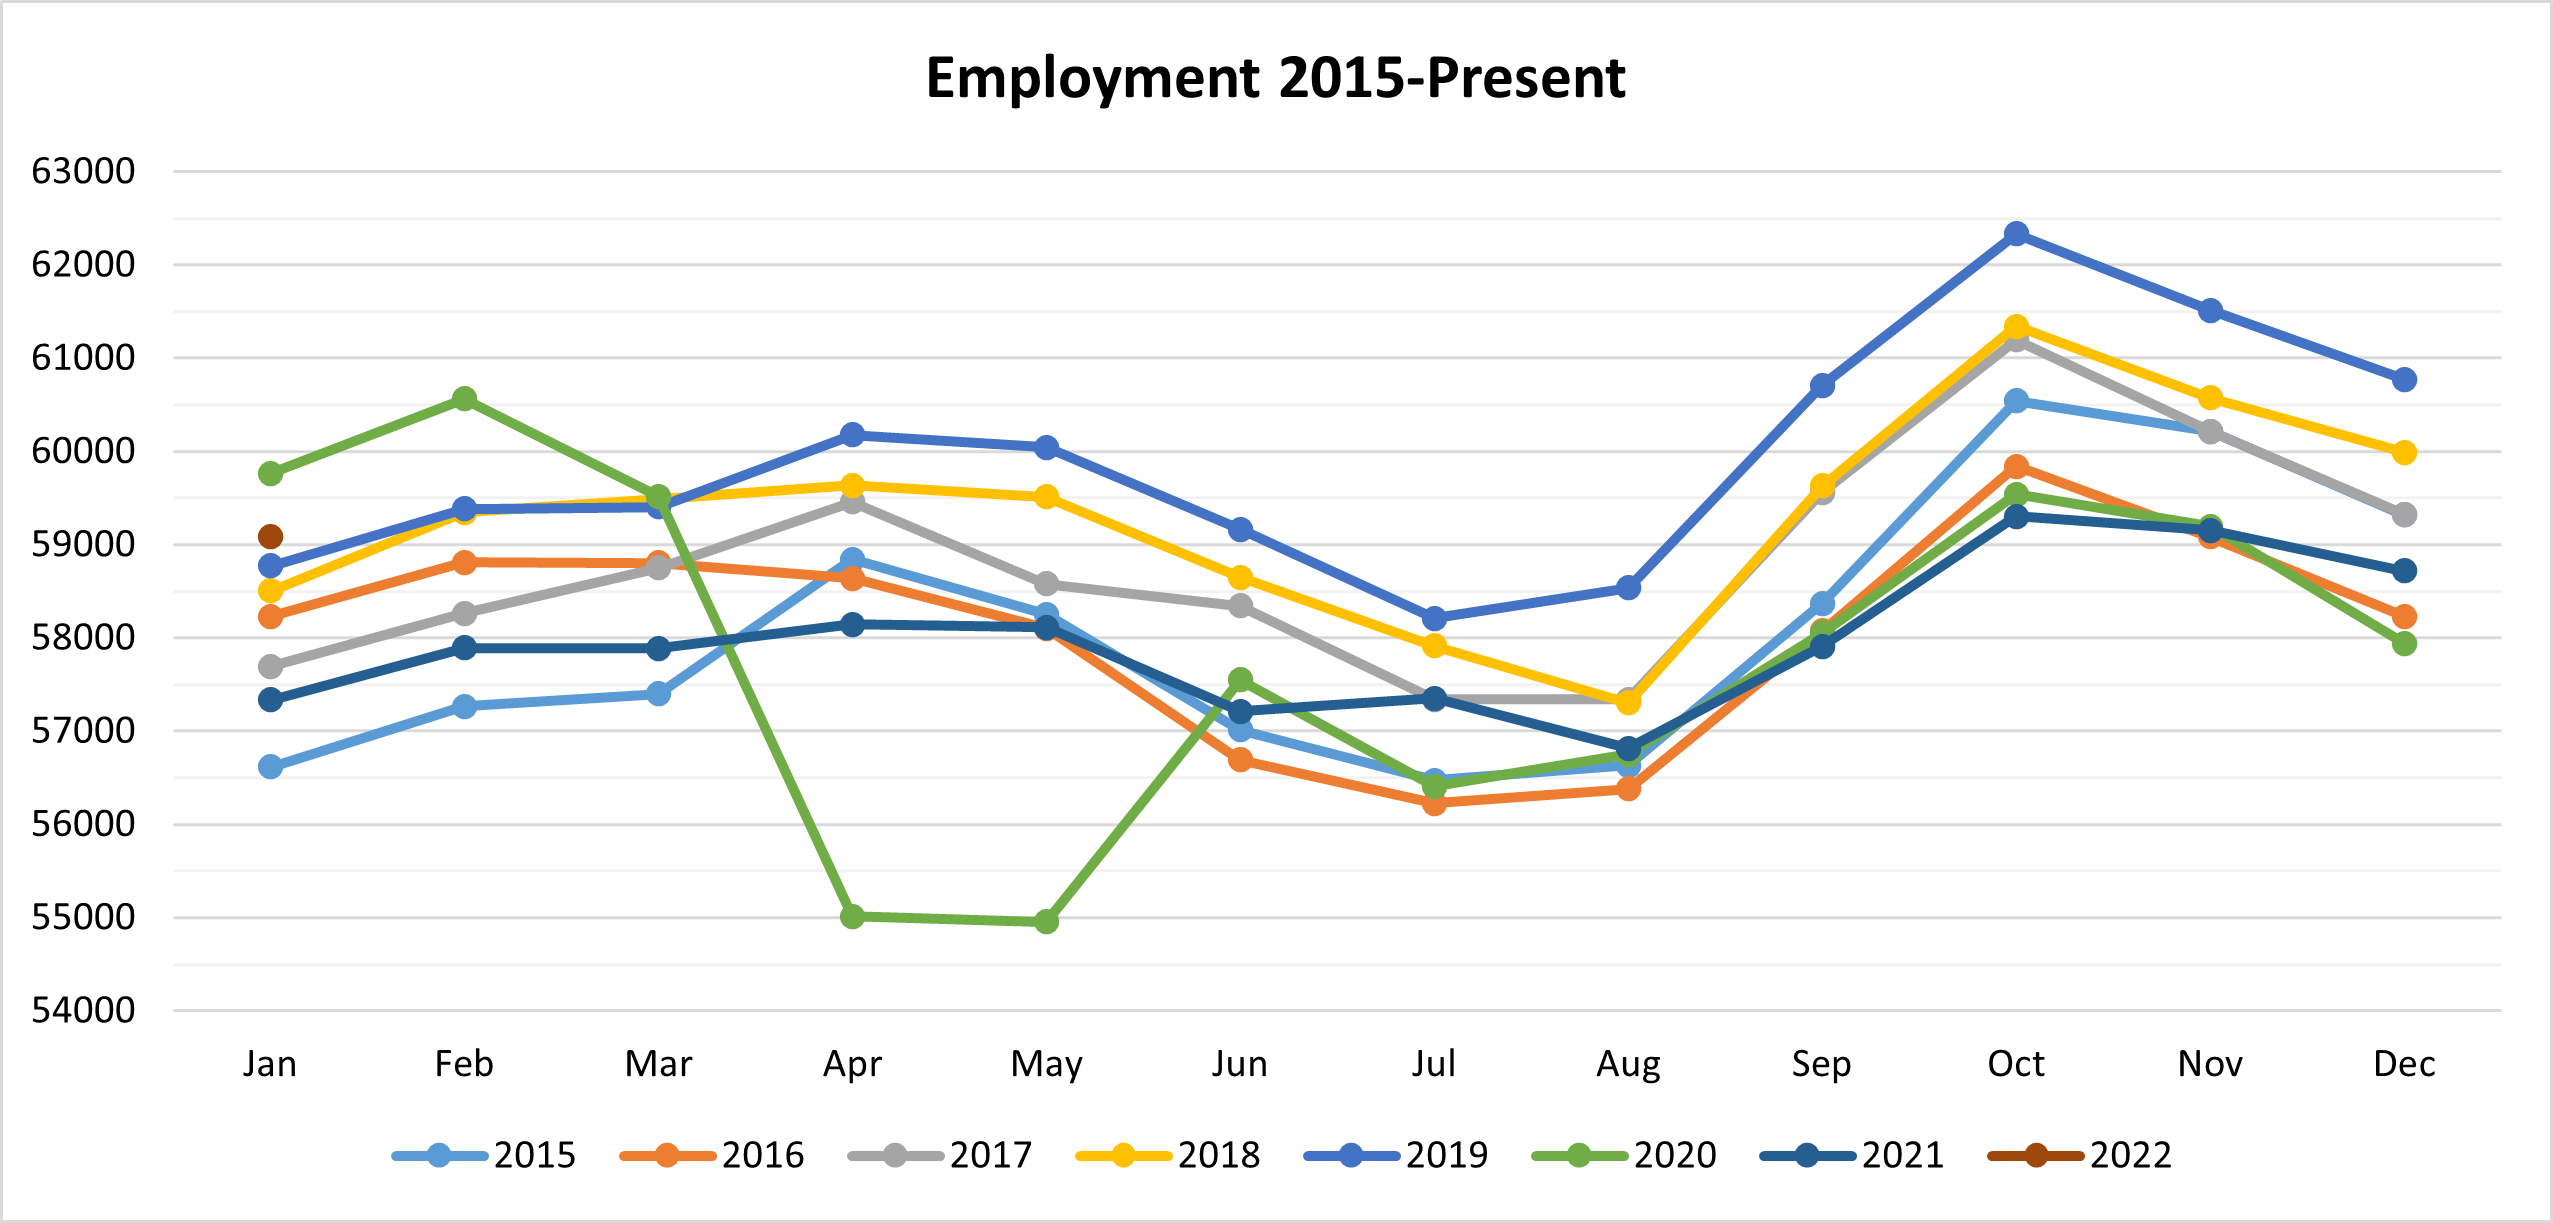
The number of non-farm jobs being worked in our region dropped from 56,300 in December 2021 to 55,400 in January 2022, a 1.6% decrease. In contrast, the number of employed individuals rose from 58,716 to 59,082 over the same period, a 0.6% increase. Individuals entering the labor force rose by an even higher 1.1% (688) people. Between December 2021 and January 2022, the labor force rose from 60,050 to 60,638 – its highest point since November 2020.
As a retail destination and a region with multiple manufacturers with seasonal peaks during the holidays, historical trends suggest that both employment numbers and jobs worked will fall between December and January. Historically, individuals outside the labor force (youth, retirees, stay-at-home parents, etc.) enter the labor force on a seasonal basis to work these jobs. As they exit the labor force in January, there is a consistent annual drop in the number of employed individuals in the community. The drop in jobs being worked is even higher as individuals working multiple jobs stop working part-time seasonal jobs On average, since 2015 worked jobs dropped by 2.1% and employment dropped by 1.2%.
This year, our region bucked the trend of a reduction in the number of employed individuals as it was the first year since 2013 to see more employed individuals in January than in December and we saw the second-lowest percentage of worked jobs being lost (between December 2020 and January 2021 worked jobs fell by only 0.9%).
What is the difference between LAUS and CES Data?
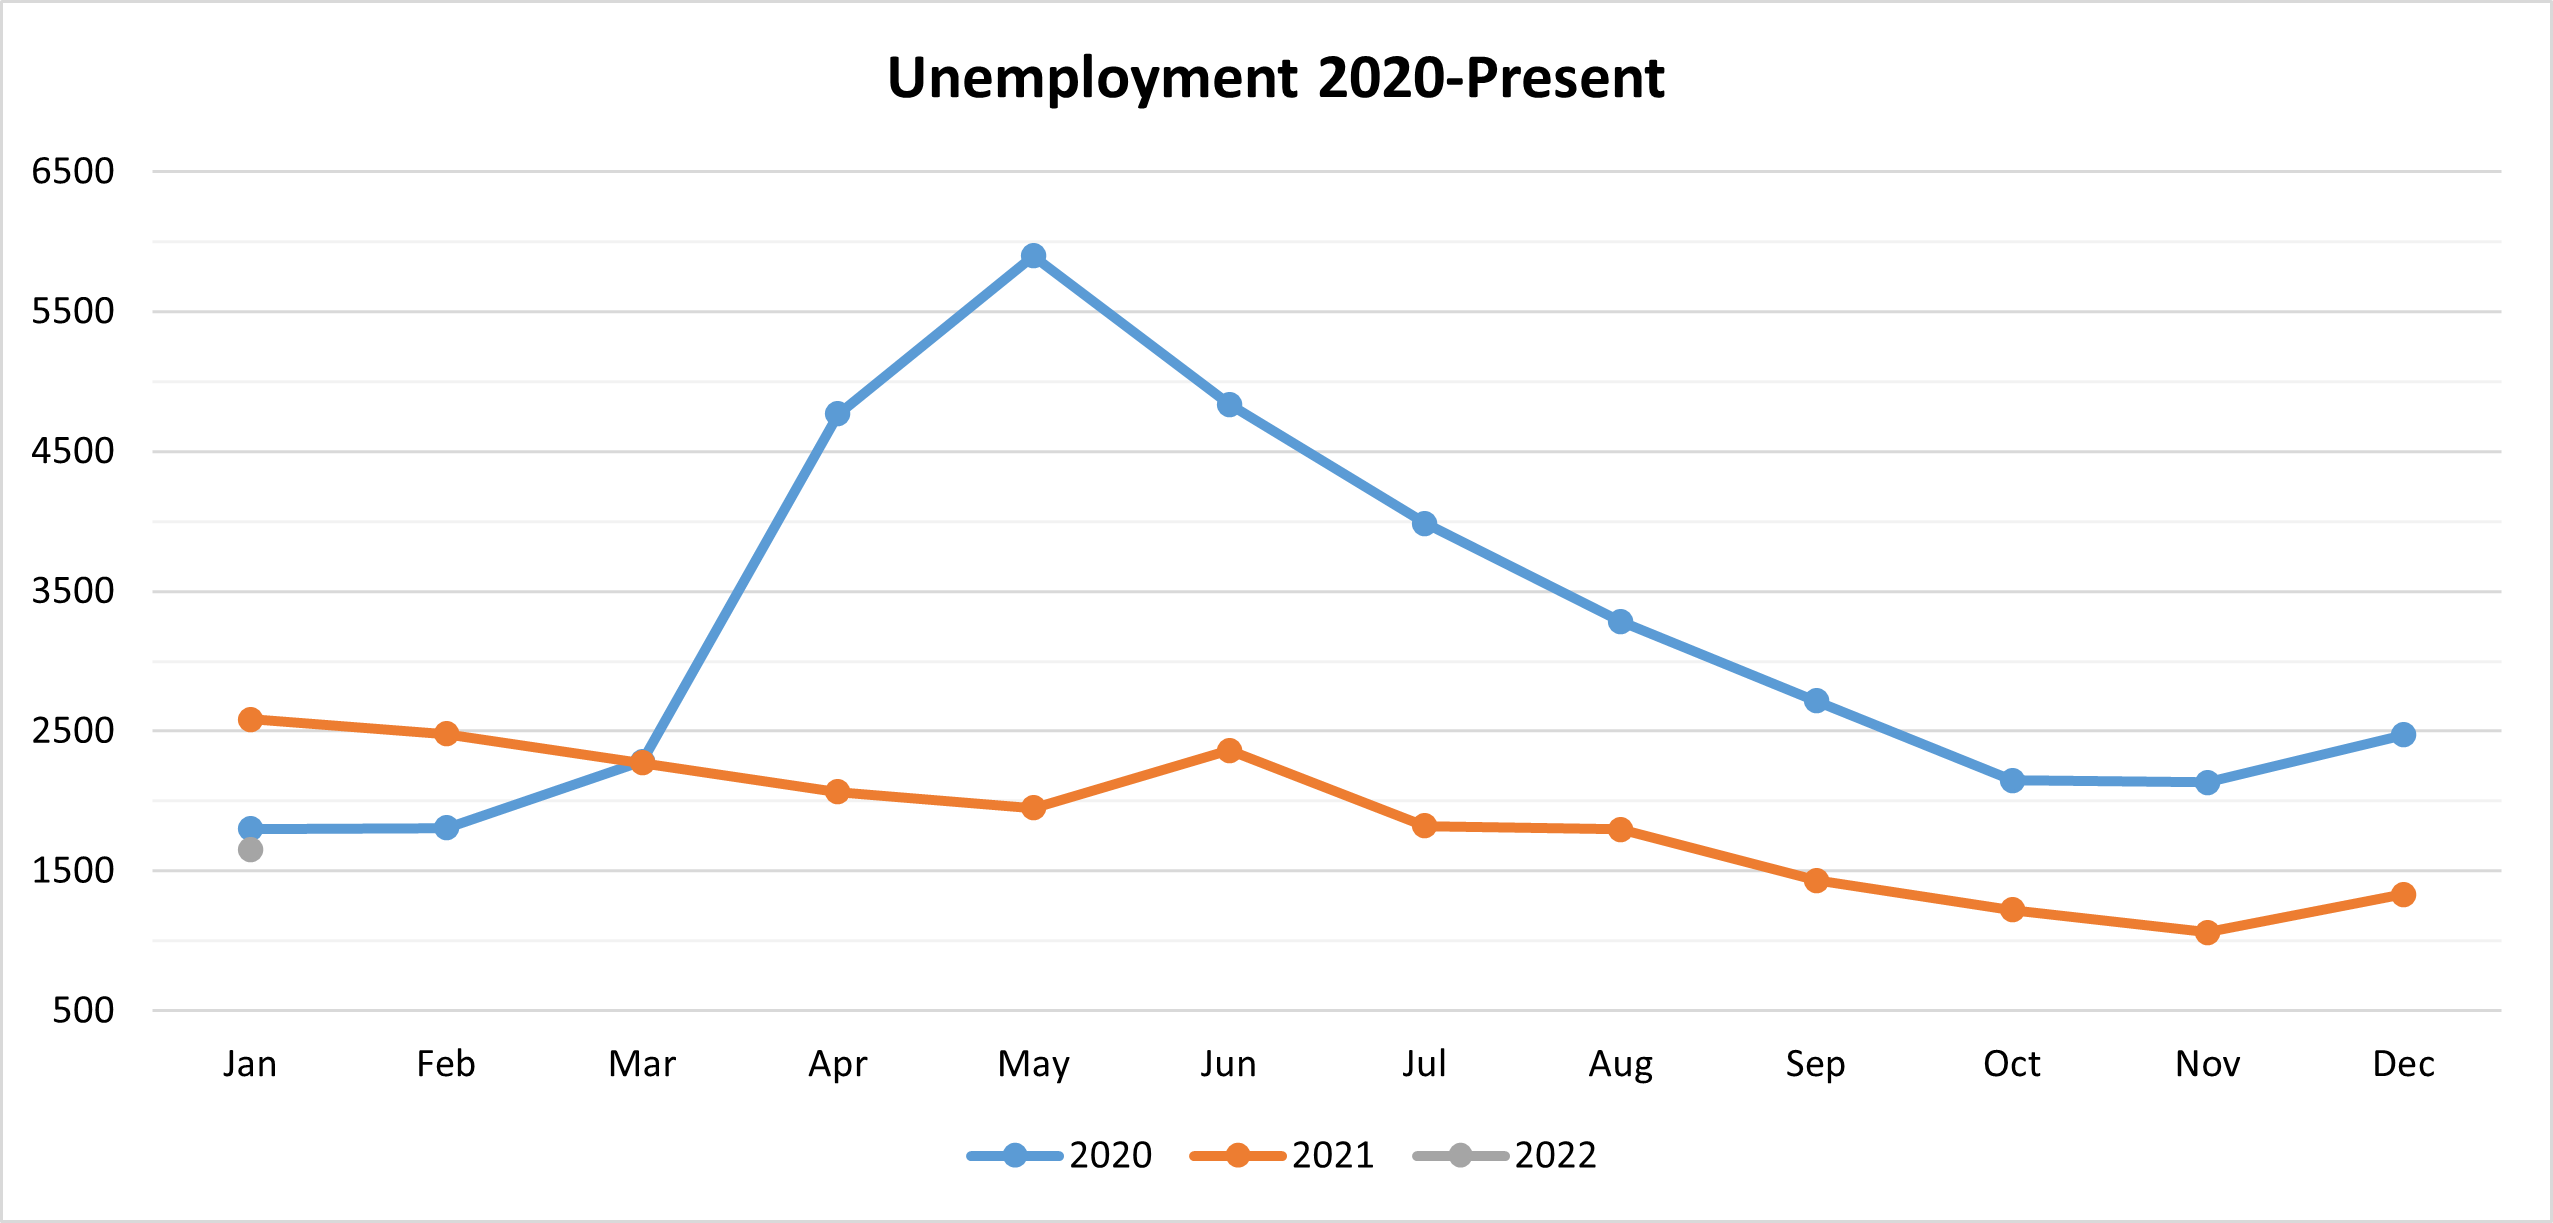
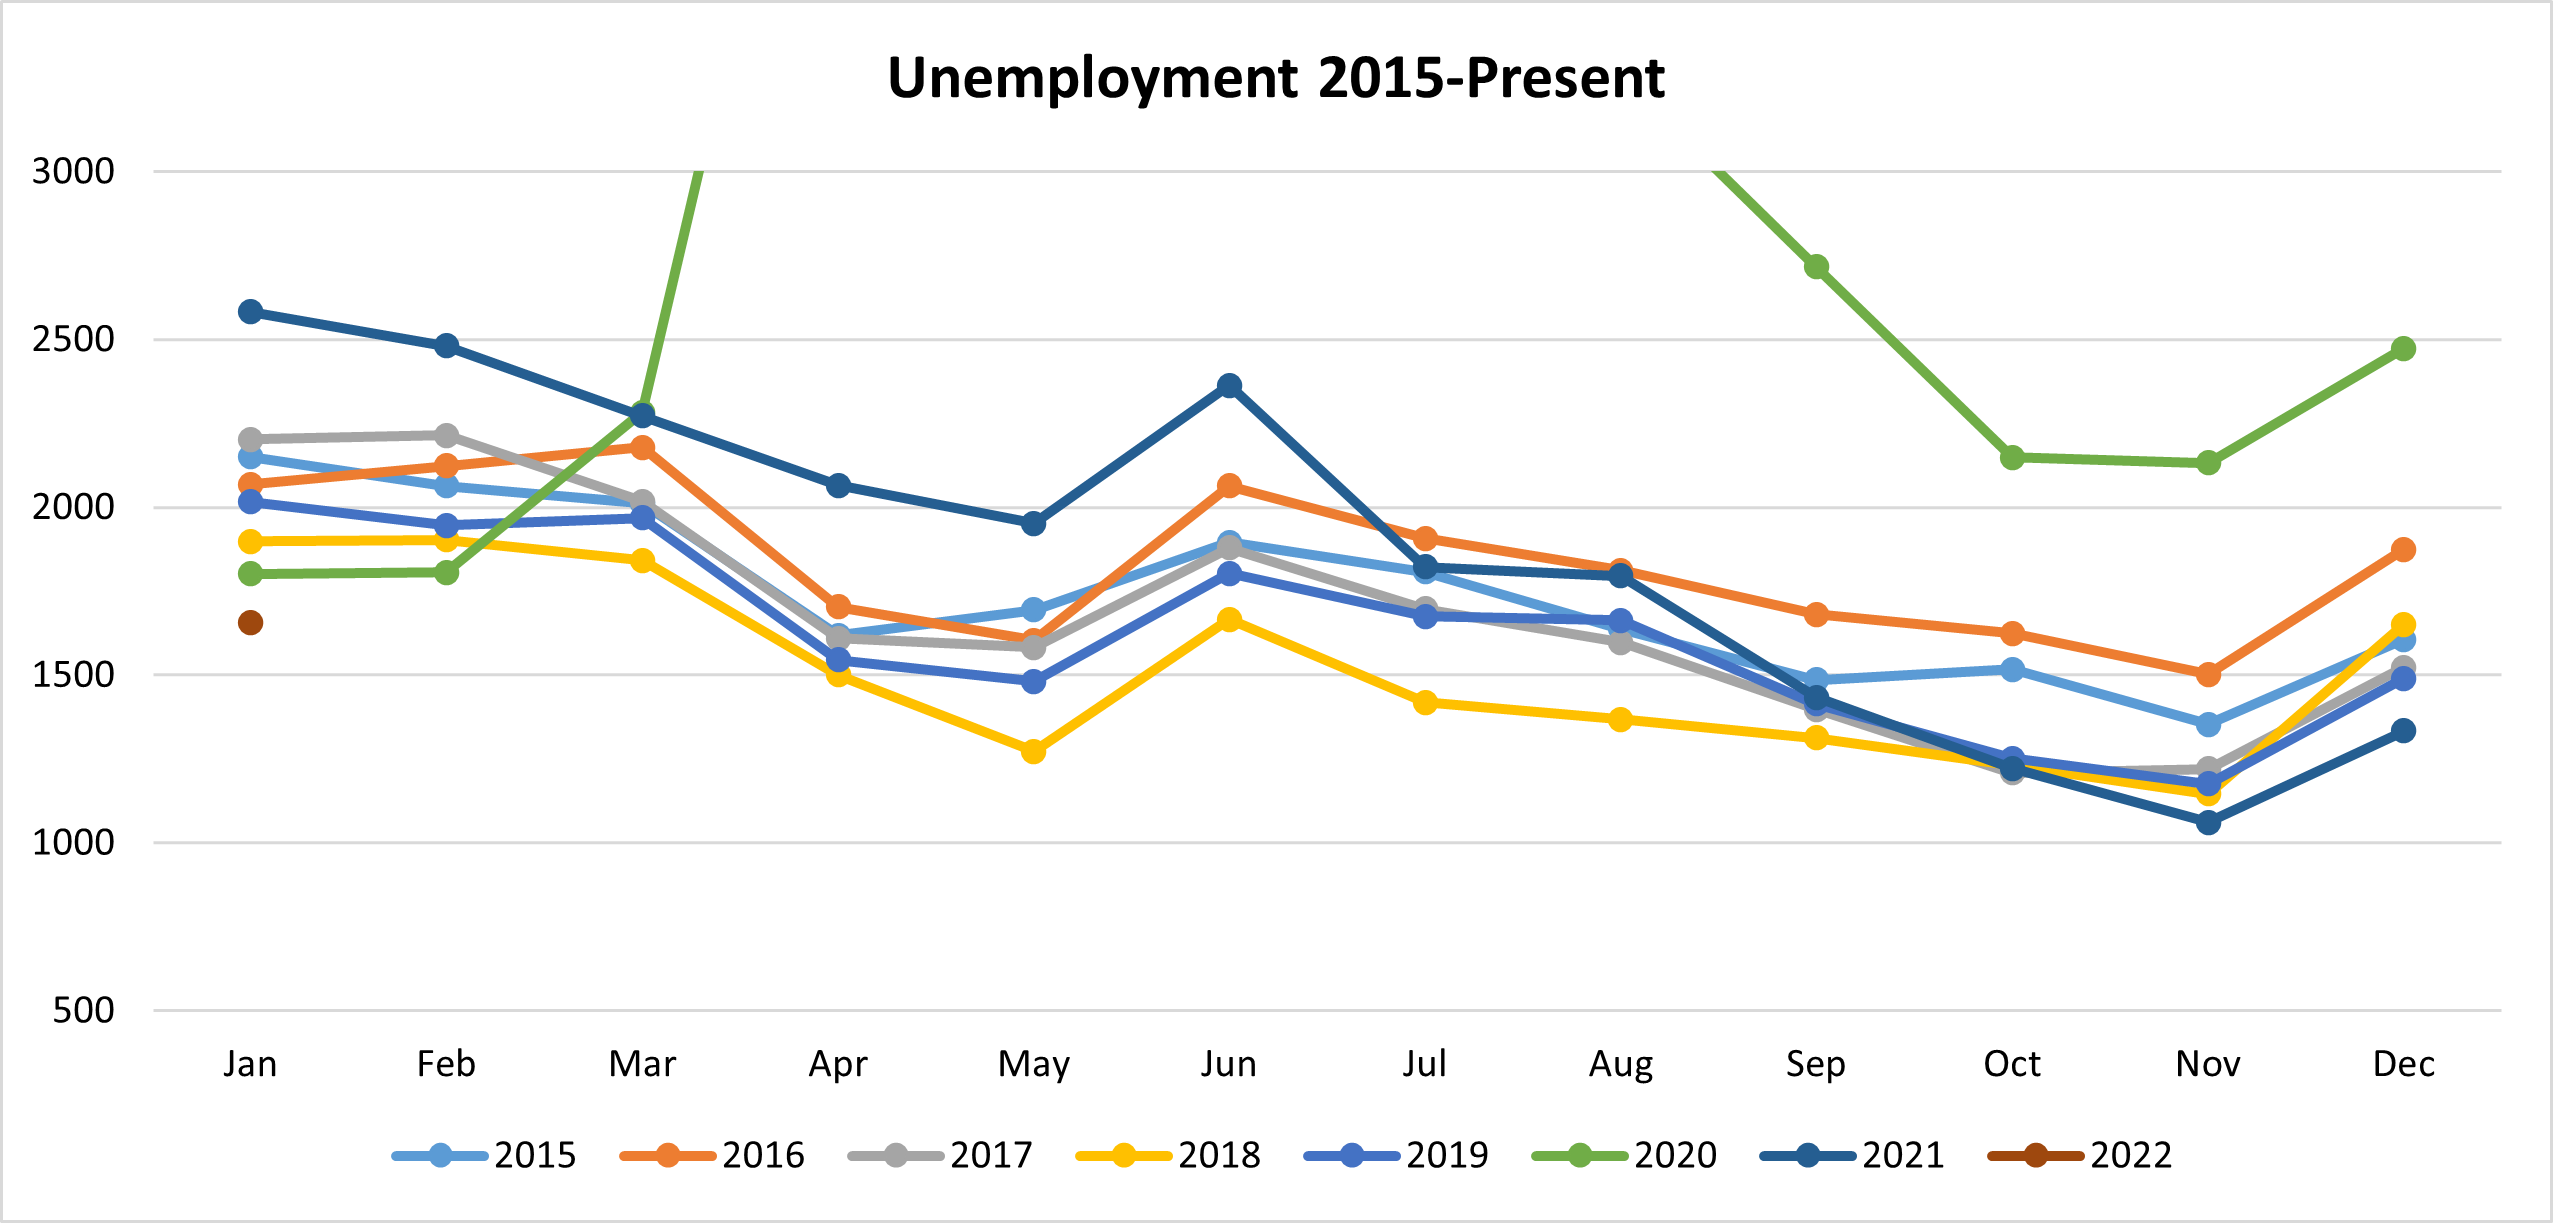
LAUS data reports on residents living in Blue Earth & Nicollet County. Four data categories are provided: the labor force of our region, employed individuals living in our region, unemployed individuals living in our region, and the unemployment rate. Individuals living in our region but working outside our region are included in this data.
In contrast, CES data reports non-farm payroll. This data, which helps us identify the number of jobs being worked in our region, focuses on the number of paychecks being issued by employers in our region. Individuals living outside our region but working inside our region are counted in the non-farm payroll numbers and individuals working multiple jobs are counted multiple times. Individuals living in our region but working outside our region are not included in this data.
More people commute into the Mankato-North Mankato MSA for work than who commute out of the region, so a natural expectation would be that the CES (jobs) data would be higher than the LAUS (employment) data. Instead, CES data is lower due to a few key factors. As the name suggests, non-farm payroll does not report on farm workers. Additionally, the data does not include self-employed individuals, sole proprietors, military personnel, and a handful of other categories.
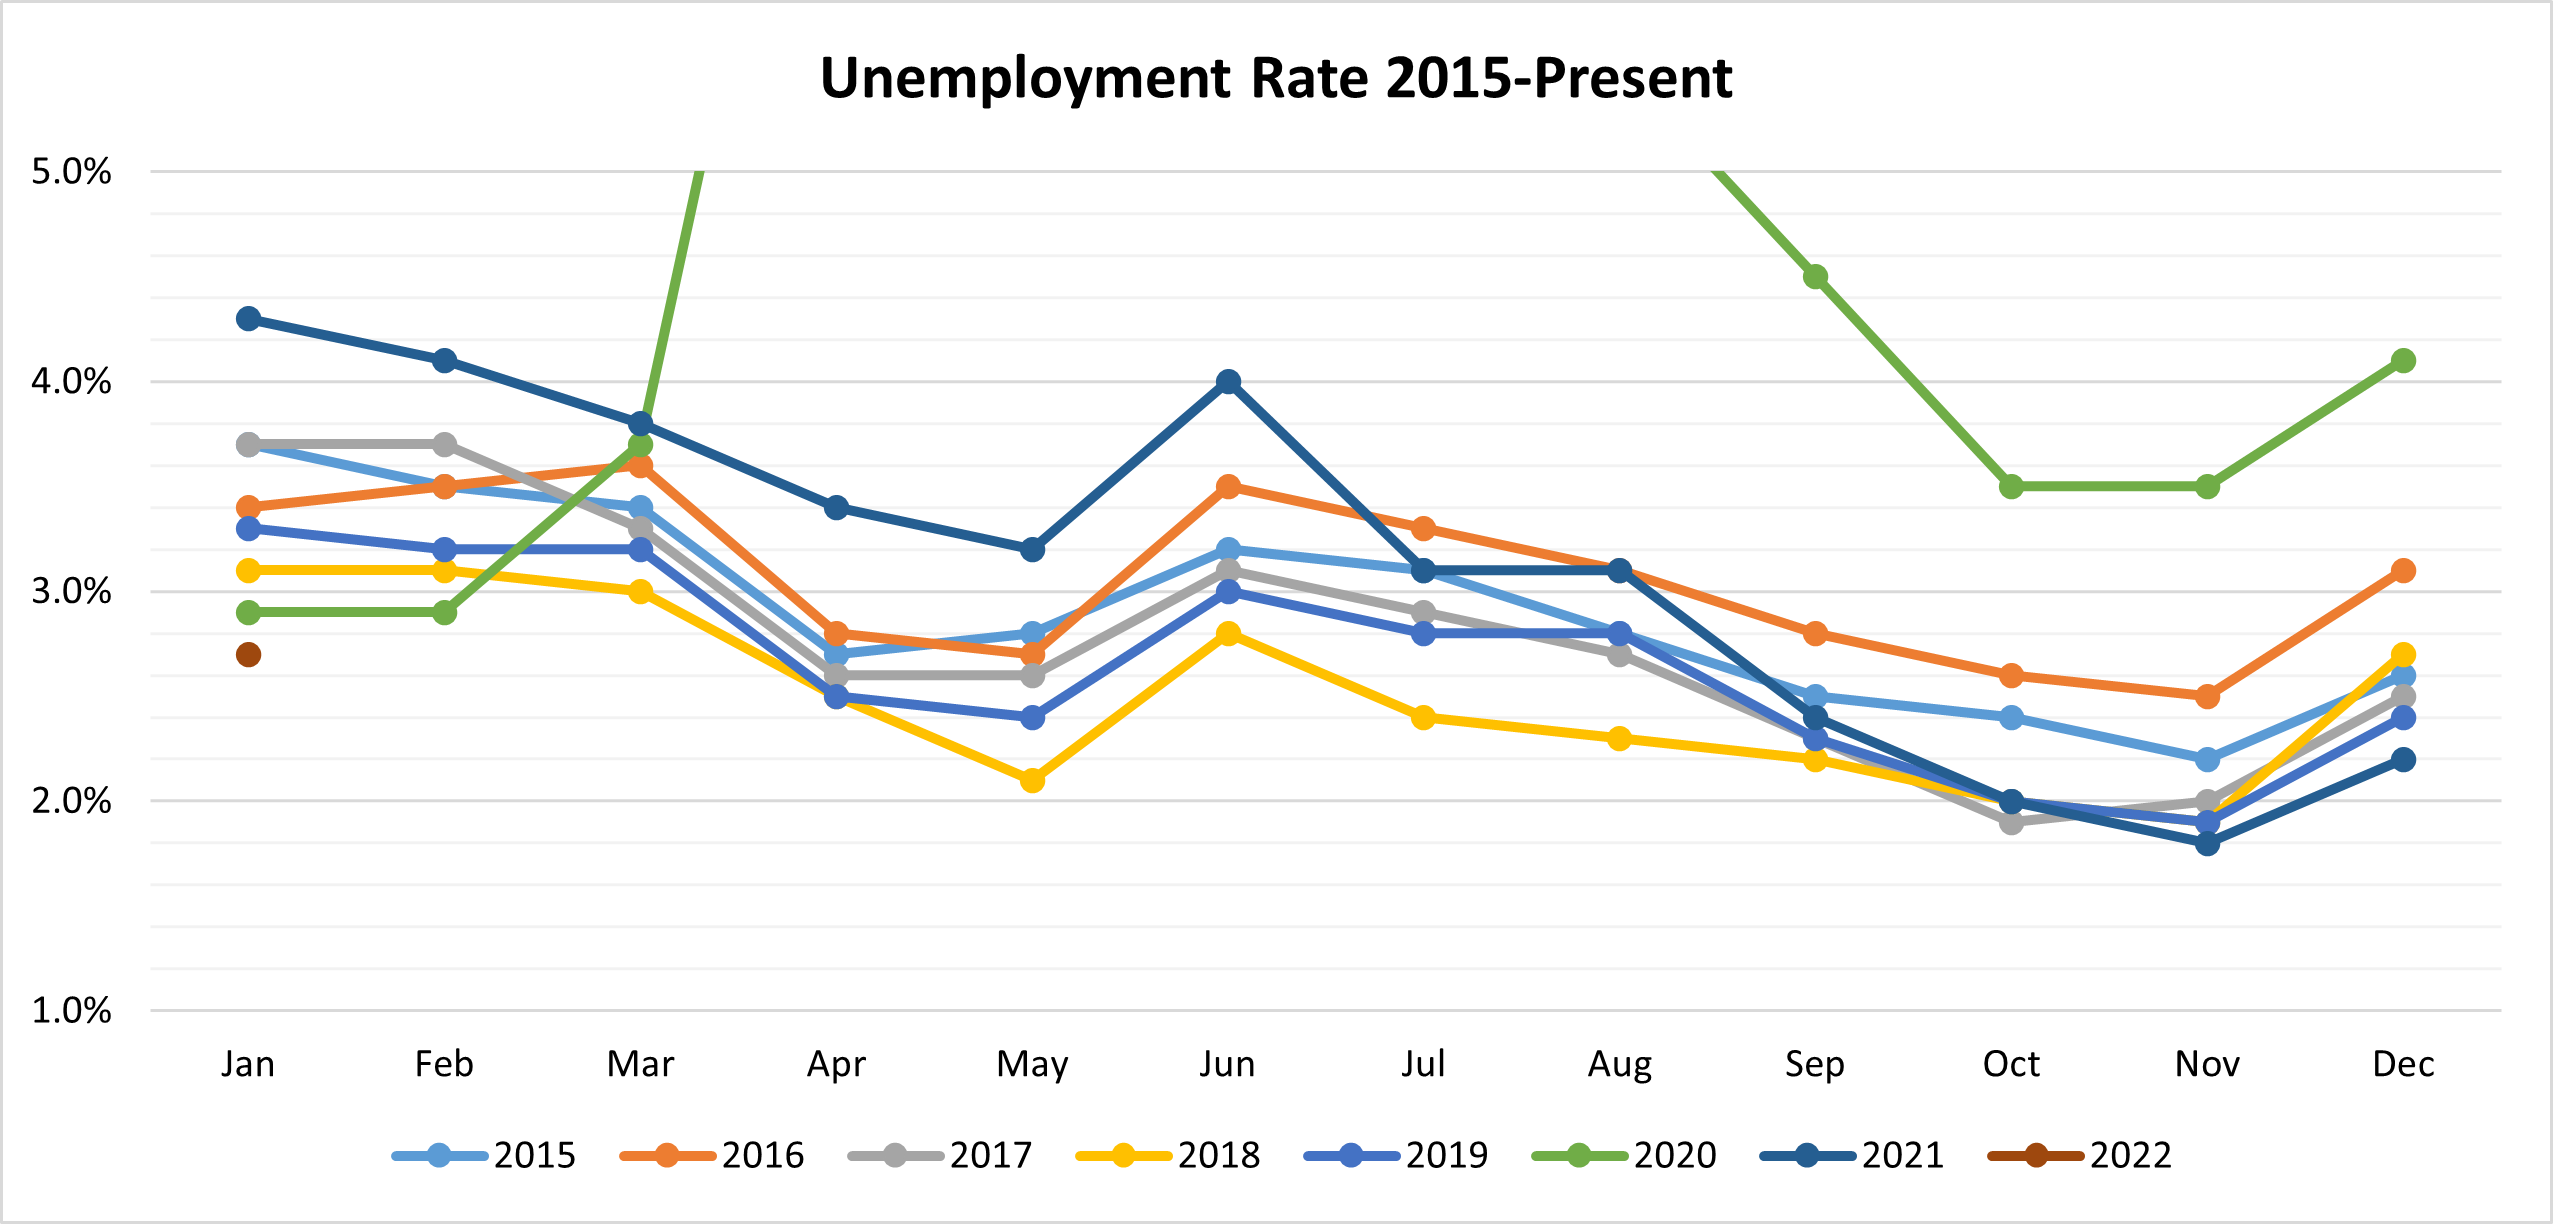
Monthly Charts